Wasn’t it just yesterday that the world watched as regional conflict threatened to burst from miasmal smolder into rampant conflagration? The same week that labor action in the United States threatened its seemingly endless appetite for imported goods? The week of dire warnings that Russia would break through the Ukrainian lines and overrun Kyiv anydaynow? No, it was the week when the Chinese Communist Party pried open the creaking doors of its dusty fiscal policy armamentarium to reveal an unused bazooka—that blew only smoke.
Or was it the fortnight after the Federal Reserve cut benchmark interest rates by half of a percent, and during which construction numbers and home sales data improved, mortgage rates drifted lower, retail sales were fine, inventories were somewhat depleted, consumer confidence and sentiment achieved recent peaks, and inflation as measured by the Personal Consumption Expenditures (PCE), the Fed’s preferred measure, lightly tapped the tarmac?
That can’t be, as it was the two-week period during which the oil price spiked, and a Federal Reserve Board Governor, auditioning before an audience of one for a future role as Fed Chair, gainsaid falling inflation data and warned of a return to ever-rising prices. But how can that be, since US manufacturing data showed continued contraction? Eurozone inflation also fell below target, further confounding the prediction. Perhaps an answer lies in the increase in Job Openings, which far outstripped expectations. Then again, the Quits rate continued to spelunk its way toward the center of the earth, signifying worker reticence to take a flyer on themselves and quit their jobs to find a better one.
The US economy, driver of world growth, is hale and hearty, expanding at a 3% clip and adding a quarter of a million jobs each month. Or perhaps its once-muscular physique now atrophies, having just added to the rolls of its newly and continuing unemployed a host of hurricane refugees and striking laborers. Or is it both, as inflation is rising while growth is failing, presenting the haunting specter of Stagflation? [scary music]
“I leave to the various futures (not to all) my garden of forking paths”
In Jorge Luis Borges’ masterpiece of a short story “The Garden of Forking Paths”, the antagonist confronts the bifurcating nature of reality: from every event with a binary outcome, two alternate universes proceed into infinity. By now the concept is commonplace to a culture well-versed in science fiction and fantasy tropes that feature time travel and parallel universes. And we are led to understand that only one of these paths matters: the one that reality ends up taking.
As anyone who has studied statistics with a modicum of rigor understands, the path that reality took is in fact of minimal importance when compared to the scale of the paths that reality could have taken that, but for an accident of history, did not. And this provides a key insight into the nature of Risk itself: more things can happen than will happen.1 Moreover, even though history takes only one of these multitudinous paths, critically those other paths nonetheless survive despite not having been taken; they retain a real future possibility of realization. An impaired driver narrowly misses my car as I transit one intersection, but he or his compatriot are still on the road when I transit the next one down the street.
So, it may seem as though we bounce from potential crisis to potential crisis. In actuality these crises are always live possibilities, and it is only the object of our focus that shifts. We never exit the labyrinth, and even when we slay the minotaur2, the minotaur doesn’t stay dead.
US Economic Expansion Continues
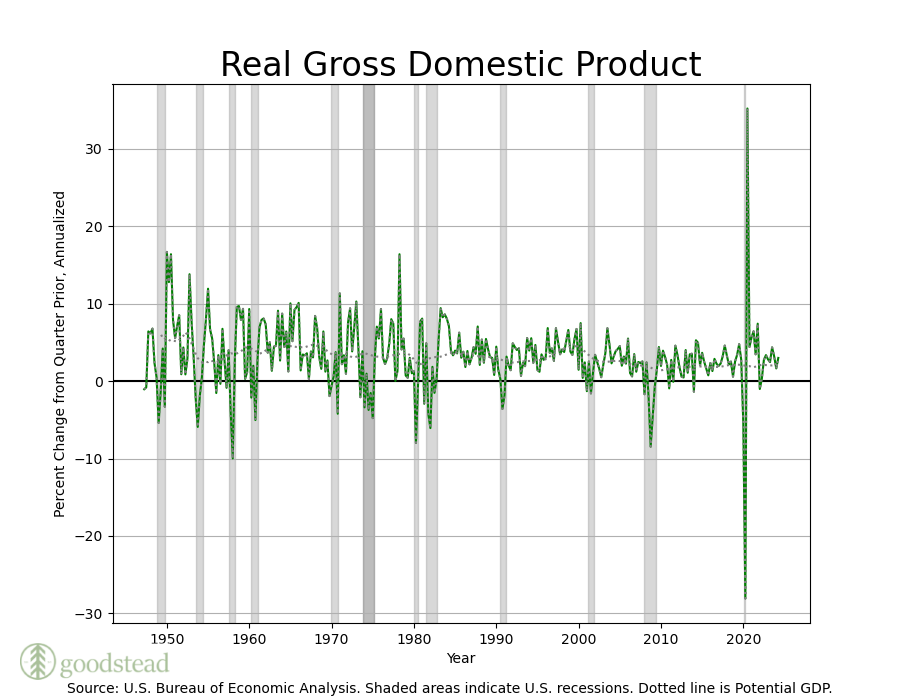
We recently received the revised GDP figures for the second quarter of 2024. Growth was unrevised at a 3% annual pace, while first quarter GDP growth was revised upward to 1.6% from 1.4%. 2023 GDP growth was revised upward .4% to 2.9%, and 2022 GDP growth was revised upward .6% to 2.5%. These are really excellent rates of growth for a developed economy, especially one as large as the US, and are well-above potential.
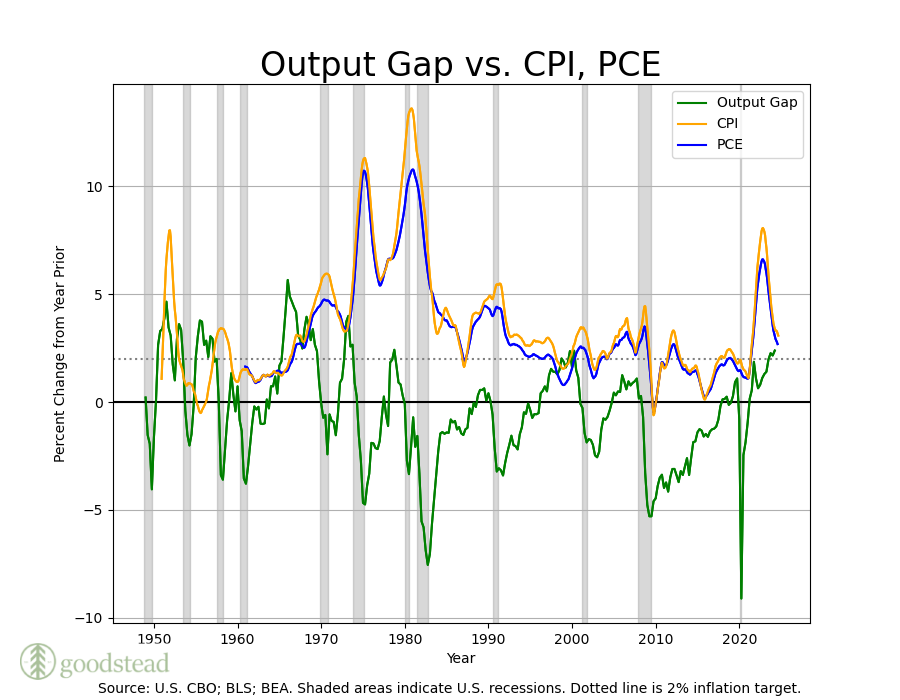
When Real GDP growth persists above Potential Real GDP growth, the result should be an increase in inflation, since the economy is wearing down its capital base and labor pool to achieve higher rates of growth. The difference between Potential Real GDP and Real GDP is known as the Output Gap. When positive, the inflation rate can be expected to increase; when negative, the inflation rate is expected to decrease. Below we chart the Output Gap against rolling one-year inflation as measured by the not-fatally-flawed CPI and its more accurate sibling, the PCE.
We can see, though, that inflation rates are steadily falling even as the output gap rises. This can occur for at least two reasons3: the first is that Potential Real GDP is an estimate, and estimates are prone to error; the second, Potential Real GDP doesn’t grow at a constant rate. The introduction of new technologies that improve efficiency increase Potential Real GDP, and so allow economies to grow at faster rates without producing upward pressure on inflation. Another way of saying this is that technological change is disinflationary.
Much wealth is currently predicated upon the emergence of Artificial Intelligence as a technological innovation on a par with the steam and combustion engines, winged flight, genomic medicine and modern information technologies. The potential for AI-powered growth is extraordinary, to say the least. But it is far too early to ascribe the current increase in productivity to AI’s still-nascent stage of development and level of adoption. It just hasn’t been around long enough or its usage widespread enough to account for the change. 4
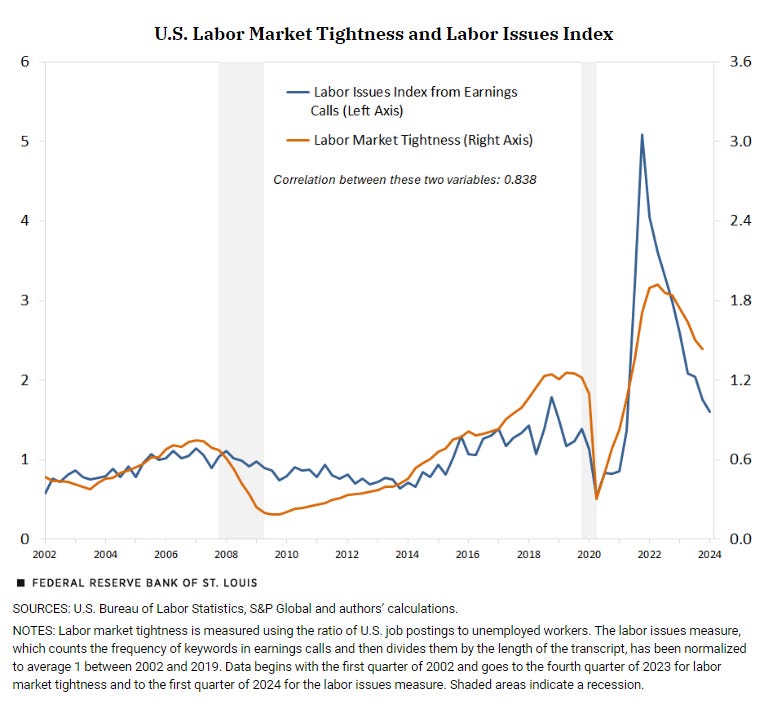
Without recent technologies to point to as the source of recent gains in productivity, we are left to speculate that the increase in productivity is rather down to adoption of already-developed technologies. And here we find some support in the data. Researchers5 at the St. Louis Fed recently used natural language processing techniques to perform a textual analysis of earnings calls transcripts. Screening for keywords related to labor issues, the study’s authors constructed an index that reflects the degree to which these issues dominate earnings calls. They then compared their index to the Job Openings/Unemployment ratio and found a pretty good fit (a correlation of .84).
Extending the analysis, the researchers used firm-level investment data to determine that a 1-unit increase in a firm’s labor issues results in a corresponding 28 basis point increase in investment. Aggregated across firms, the result is an additional $55 B in investment. The authors further point out that this amount of investment is itself comparable in size to the 2022 CHIPS and Science Act.
These technologies are not new, however were adopted once labor conditions mandated it. They are also concentrated in industries that are labor-intensive. Other productive technologies that were the result of earlier exogenous shocks, such as those developed to enable remote work—developed after the terror attacks of 2001, but largely left unused until COVID-19 necessitated their adoption—are supposed to have increased productivity in knowledge working industries, though there the data are less supportive6—though not dispositive.
What Is Juicing US Growth?
The US economy enjoys positive growth prospects unmatched anywhere else in the developed world. As we wrote at the beginning of the year, the present period resembles none so much as the mid-1990’s, when another Fed Chair orchestrated a soft landing, and an extended period of economic growth ensued.
First, the US will likely see a boost in demand via the Infrastructure Investment and Jobs Act, CHIPS and Science Act, and Inflation Reduction Act that amounts to an additional $2.4 Trillion of public and private spending over ten years, starting from 2021. At an average of a quarter trillion dollars per year, that’s a serious sustained tailwind. Add to this the elevated level of corporate capital expenditure for AI, totaling over $200 Billion in 2024 for Big Tech alone, and you have an absolutely massive amount of spending—and one firm’s spending is another firm’s income. Lastly, spending for capital equipment for datacenters and the infrastructure to support them contributes another hundred billion or so per year to these figures.
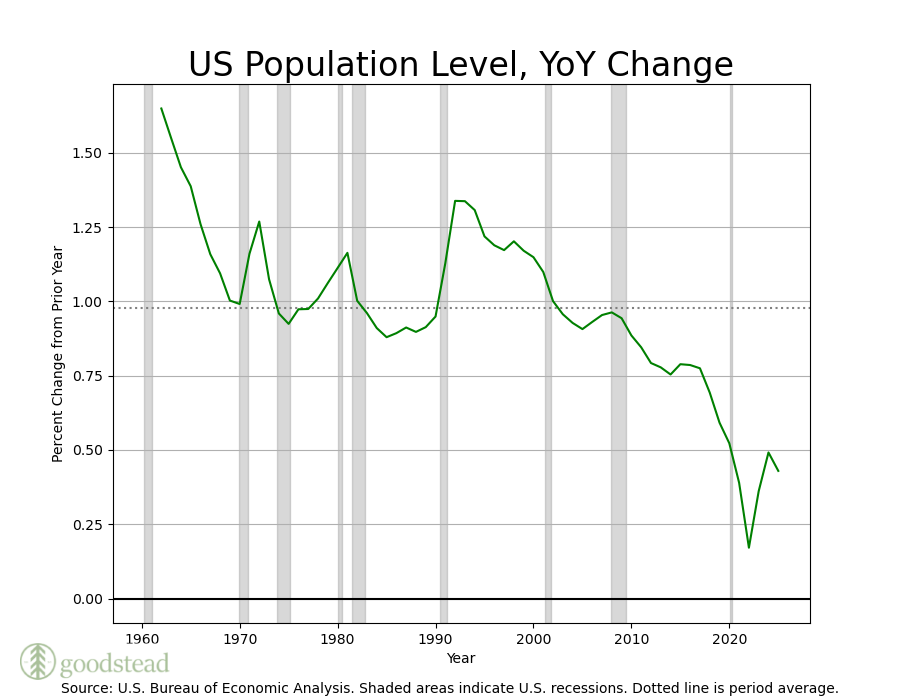
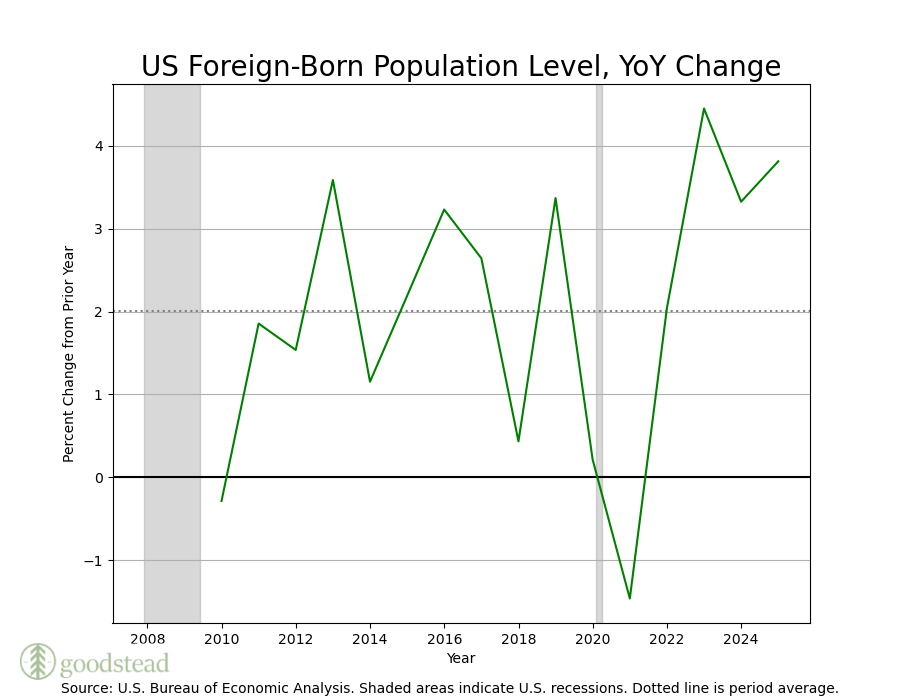
Given the vast amount of spending both by public and private entities over the next decade, it would be remarkable if GDP growth didn’t reach a higher gear. But yet another positive factor provides support to economic expansion in the United States, and that it is its demographic growth rate. Developed economies the world over are marked by their declining natural rate of population growth, typically in the mid-teens or lower. But the United States’ population growth rate has rebounded to the same level at which it stood pre-Pandemic, about .5% per year. Human Capital, like Physical Capital, is one of the two drivers of GDP—and the US is unique among its developed peers in its ability to attract and develop Human Capital.
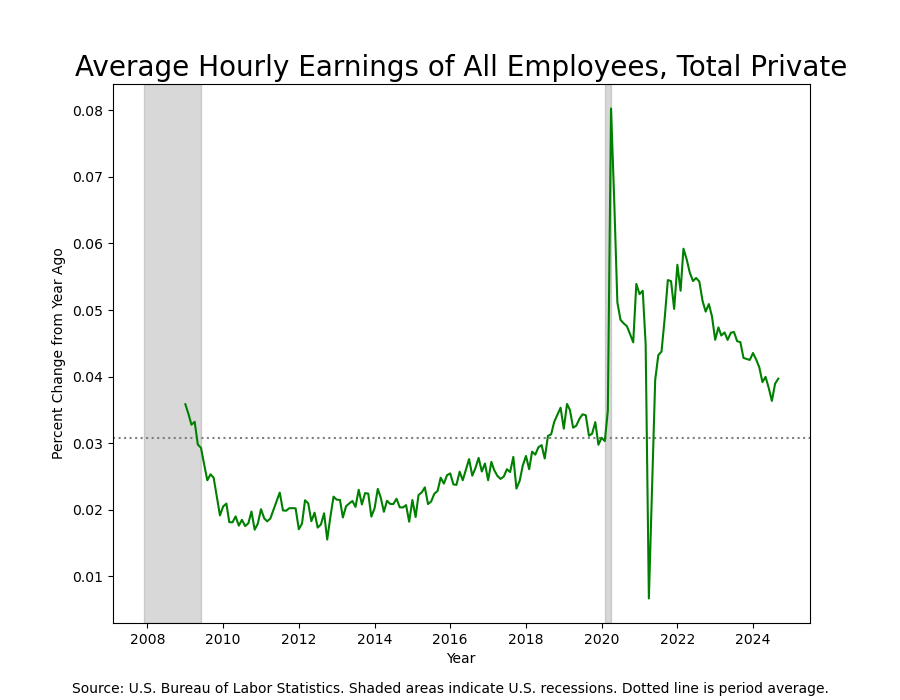
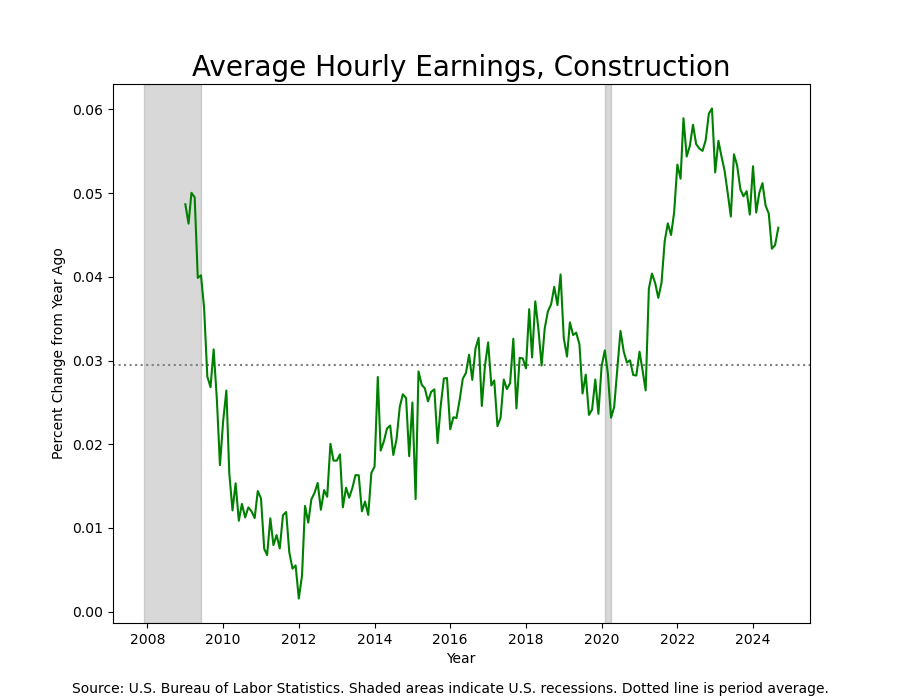
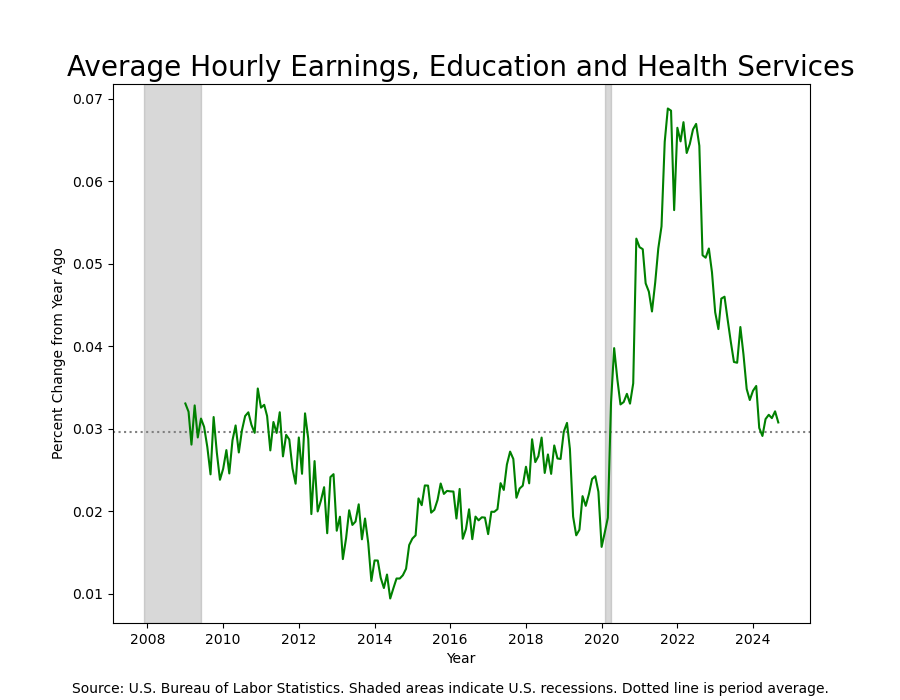
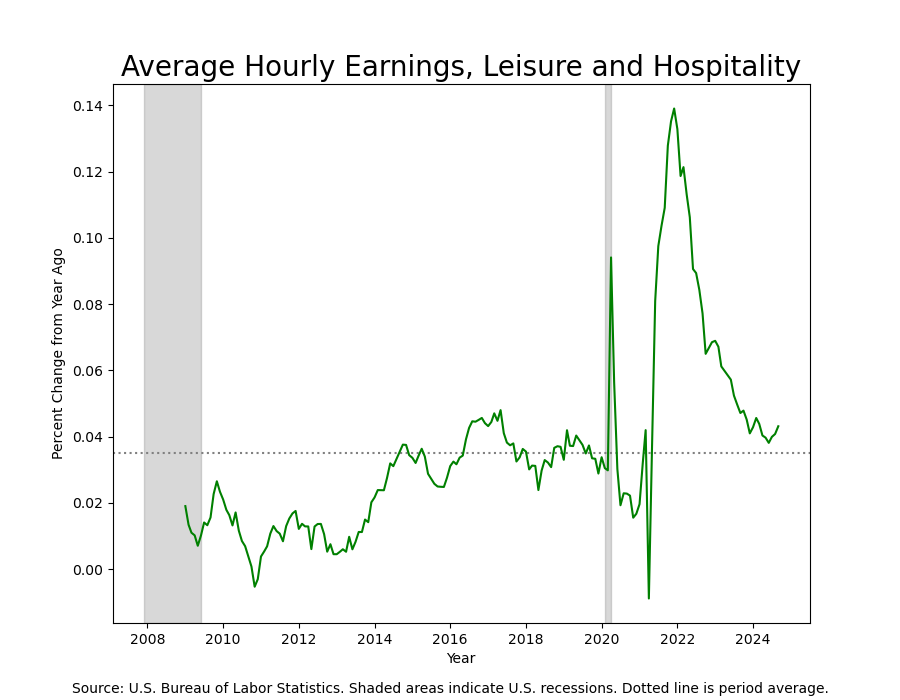
Indeed, three growth sectors of the United States economy—construction, health care, and hospitality—all depend disproportionately on immigrant Human Capital, as we have written before. As immigration has recently returned to its pre-COVID levels,
we see average hourly earnings in these vital industries trending downwards. As evidenced in the charts below, the year-over-year change in all three is down off of Pandemic highs, and except for Construction, at or near their averages since 2008.
Immigration not only relieves inflationary wage pressure in services, but it also provides an additional fillip to demand: all of those new arrivals need places to live, furniture to repose in, cars to drive and food to eat. Without resorting to some fancy econometric techniques, it is difficult to disaggregate native-born demand from foreign-born demand; suffice it to say that if the population has increased by 5 - 10 MM over the past year, it is not crazy to assume that demand has increased by 1.5 - 3%.
Is High Growth Already Priced In?
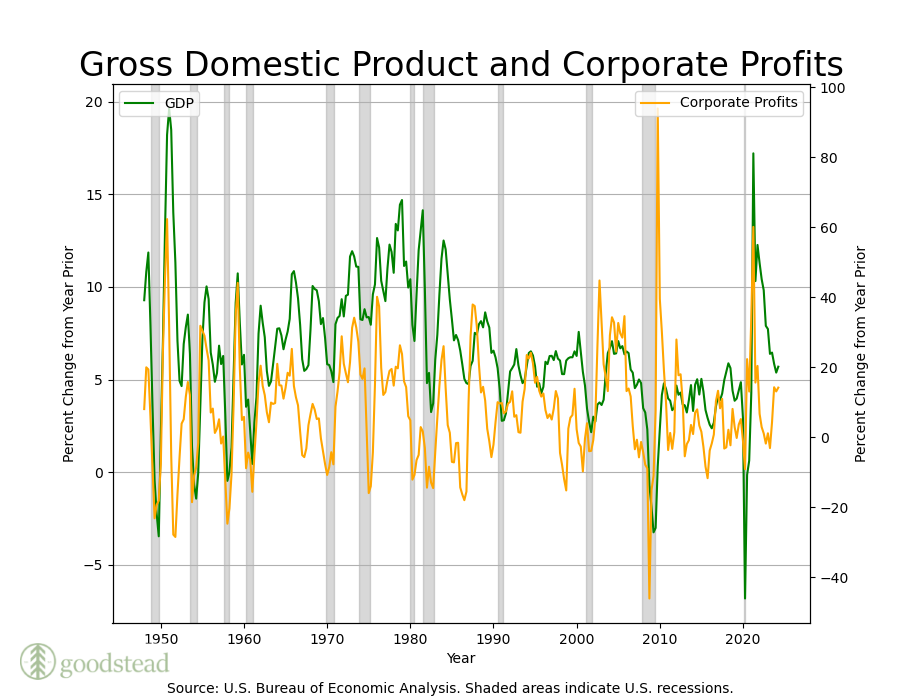
GDP and Corporate Profits are strongly positively related (.98 correlation); their growth rates are less so (.4 correlation). But plotting Corporate Profits After Tax against nominal GDP growth, we can see that they move together. (GDP growth is plotted on the left axis, and Corporate Profit Growth on the right.)
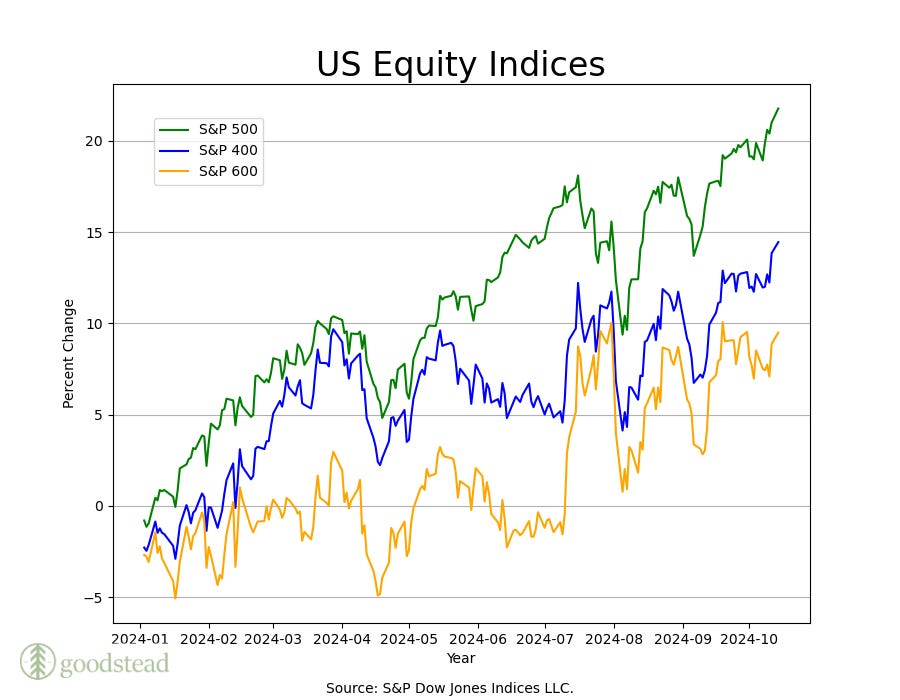
In theory, the market capitalization of US equities should correspond to US GDP growth to a certain extent, as earnings growth is of course positively related to GDP growth. But it is difficult to say anything precise about whether the lofty valuations of US equities are justified by the supernormal level of US growth. Typically, the smaller the firm, the more likely it is to derive its income from domestic rather than international sources, so if there is a national effect, you’d expect to find it in earnings growth of Small-Cap (S&P 600) companies. US Large-Capitalization (S&P 500) equities derive their profits globally, so their earnings represent an admixture of profits obtained from without the United States, too. However, it is the Mega-Cap (S&P 7ish) names that have driven equity gains this year, while Small-Cap names have by comparison foundered.
As many have noted, the increase in market capitalization of US equities has been much more a story of price increases rather than earnings increases. Price-to-Earnings ratios, or P/E ratios, give us a sense of how many years’ worth of earnings are included in the current price. The S&P 500 is currently trading at a P/E ratio of about 30—that is, its current price is 30 times its earnings. For the Mid-Cap S&P 400, the P/E ratio is 17.4; for the Small-Cap S&P 600, the P/E ratio is 12.6. When you buy Small-Caps, you’re getting about 13 years of earnings, and 17 for Mid-Caps.
So, Large-Cap stocks are expensive by comparison to Small- and Mid-Caps, but as we mentioned this is largely driven by the market capitalization of just a handful of stocks. The Mega-Cap stocks together have a cap-weighted average P/E ratio of 39.4, another 33% higher than for the broader index. Even by the expensive standards of the S&P 500, the Mega-Caps are stratospherically so.
Without getting into whether the Mega-Cap stocks will capture all the value currently priced in, we can instead ask whether the risk of loss is worth the price. For this measure, we use the Earnings Yield, a favorite measure of the founder of Value Investing, Benjamin Graham. The Earnings Yield is just the inverse of the P/E ratio and tells you how much incremental value a company produces for an initial investment in its equity. This formulation makes stock prices and earnings directly comparable to fixed income securities, which are also quoted on this basis. Using this lens, we can see that the Earnings Yield for Large-Caps is a mere 3.3%; for Mid-Caps, a more compelling 5.7%; and for Small-Caps, a respectable 7.9%. But even the Large-Cap Earnings Yield is rich compared to the 2.5% on offer from Mega-Caps.
Equities are riskier than bonds for the simple fact that bonds have a defined payout, whereas equities have a payout that is unbounded to the upside. (This is not the same as infinite.) Therefore, in order to invest in equities, you have to believe that the return in excess of a risk-free bond of similar tenor is enough to compensate for the risk of permanent capital loss. Risk-free 10-year bonds are currently offering just over 4%, a hurdle that the Large-Cap Earnings Yield doesn’t surmount. In fact, if the Equity Risk Premium, or the risk premium that equities should pay over Treasuries, is thought to be between 4.5 and 6%, then even Small-Caps fails to clear the bar.
Therefore, either equities are a bad deal at these prices, or the market anticipates that further multiple expansion will more than compensate for the poor earnings yields. And that’s not a crazy proposition: US firms have bought and will continue to buy a remarkable amount of their own shares, are relatively more attractive than their developed market peers, and possess the most favorable environment in the world for firms to do business. Global investors certainly aren’t going to cut their US equity exposures in favor of mainland China equities.
We believe that Mid- and Small-Cap equities offer a more compelling value proposition than Large-Cap equities, and that the S&P 493 is a far better value proposition than the S&P 7. We think it likely that US growth—and indeed, global growth—is priced into US Large-Caps already, and that Mid- and Small-Cap equities will be favored by the sustained earnings growth that a favorable macroeconomic environment and expansionary fiscal policy. We are therefore short Mega-Caps in favor of Large-Cap breadth, and long Mid- and Small-Caps relative to Large-Caps. We are also long equity volatility, as the process of marking down Mega-Caps and marking up the S&P 493 is unlikely to be a tranquil process.
Lastly, our interest rate outlook has sharpened in focus over the past couple of weeks. We still believe that the neutral rate of interest is higher than it was in the post-GFC era and will remain structurally higher in this era of higher fiscal deficits, supply chain reformation, energy transition, and AI investment. We think a return to a 1.5 - 2% neutral rate is likely justified by the rhymes the current environment makes with the mid-1990’s. Similarly, we expect that inflation will remain elevated, in the 2 - 2.5% range. We believe a policy rate of 4% is appropriate given these conditions, and so see the Fed slow walking interest rate cuts over its next two-to-three meetings to get there. We do not see resurgent inflation, but we do see uncooperative inflation, as well as continued, but decelerating growth. These conditions favor the Value over the Growth factor, and our portfolios reflect this bias.
Next week we’ll check in on the Global Market Portfolio and discuss our outlook for other Developed and Emerging Markets. As we wrote earlier this year, the hard forking of the US and Eurozone economies has resulted in the two regions operating substantially different monetary policies. Emerging markets present a generational opportunity, containing forks of its own: both long (India, Japan, Southeast Asia) and short (China). The world hasn’t been this interesting in twenty years.
Elroy Dimson’s definition of risk.
The half-bull, half-human monster of Greek myth that lived at the center of Minos’ Labyrinth on Crete, it serves as a particularly apt metaphor for irrationally upward-trending markets.
Another reason, of course, is one that we actually witnessed: the rise in inflation during COVID-19 wasn’t due to an increase in demand, but rather a decrease in supply. Said differently, the economy suddenly lost a huge amount of its productive capacity, which led to an increase in inflation. Even though demand cratered, supply cratered even more, resulting in a rapid rise in the general price level.
We’re reminded of Robert Solow’s quote: “You can see the computer age everywhere but in the productivity statistics.” Dividends from technological investment are sometimes harvested only slowly. The productivity miracle of the 1990’s was largely due to the adoption of computing technologies that were developed in the 70’s and 80’s.
“Using Earnings Calls to Gauge Labor Market Tightness (stlouisfed.org)” and “Does Worker Scarcity Spur Automation? Evidence from Earnings Calls (stlouisfed.org)”. Dueholm, Mick, Aakash Kalyani and Serdar Ozkan.
“Does Working from Home Boost Productivity Growth? - San Francisco Fed (frbsf.org)”


