Wrestling with Angels
The last fortnight was a pretty interesting one in the good ole US of A. We got some new inflation numbers, had a Federal Open Market Committee (FOMC) meeting, Fed Chair Jerome Powell rattled a saber, jobless claims reached a six-month high and unreliable sentiment surveys fell.
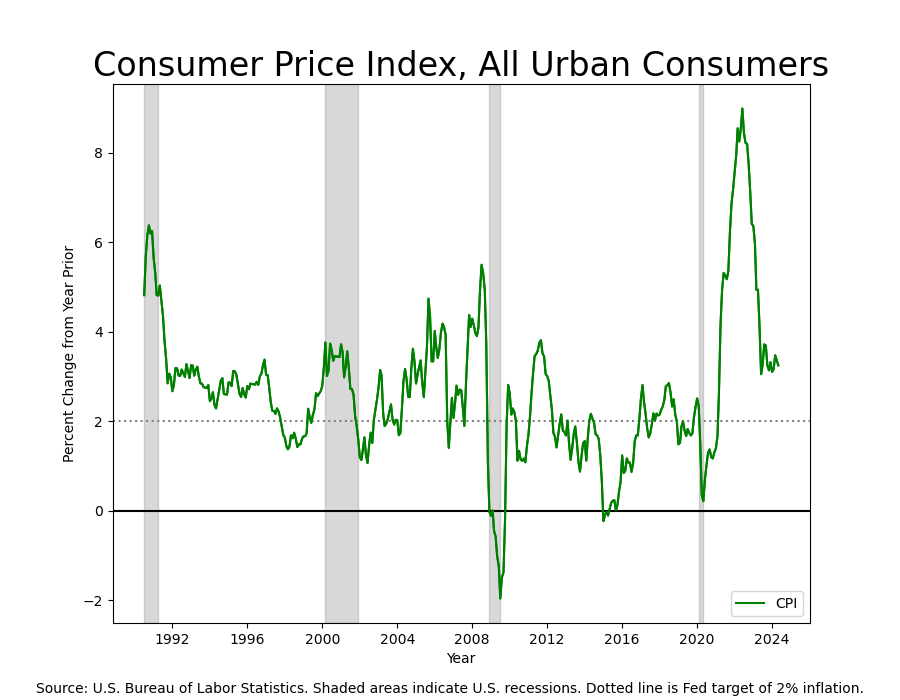
Let’s start with inflation. The not-fatally-flawed Consumer Price Index (CPI) came in at 3.25% year-over-year, which change created a three-month downward trend. This was slightly better than expectations of no change from the prior month, though inflation is still higher than the Fed’s target.
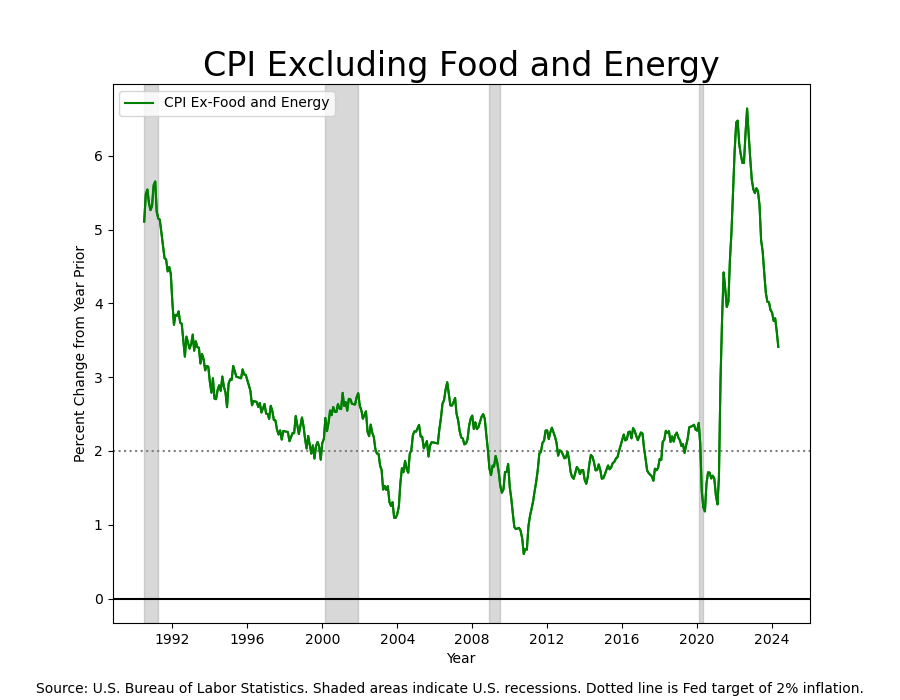
When stripping out food and energy—which are the two items that people complain about most when they complain about high and rising prices—we can see that core inflation at 3.4% year-over-year has returned to levels last seen in the mid-1990’s.
Inflation is still quite high relative to target, so no one should lose their mind over this data, but it’s trending in the right direction after a string of disappointing data points at the beginning of the year.
Despite the better-than-expected news on inflation, the Federal Reserve left rates unchanged at their Wednesday meeting. Citing the need for “greater confidence that inflation is moving sustainably toward 2 percent,” it left the policy rate at 5.25%-5.50%. Given the level of inflation, and the robustness of the economy, this isn’t a crazy decision.
It was also the decision that the markets had expected. What the markets didn’t expect was that the Summary of Economic Projections (SEP)—which contains the FOMC members’ best guesses about where a number of economic indicators will come in over the next few years, and which is informed by their staff economists’ econometric models—suggested that the FOMC doesn’t think inflation is coming down as soon as they thought.
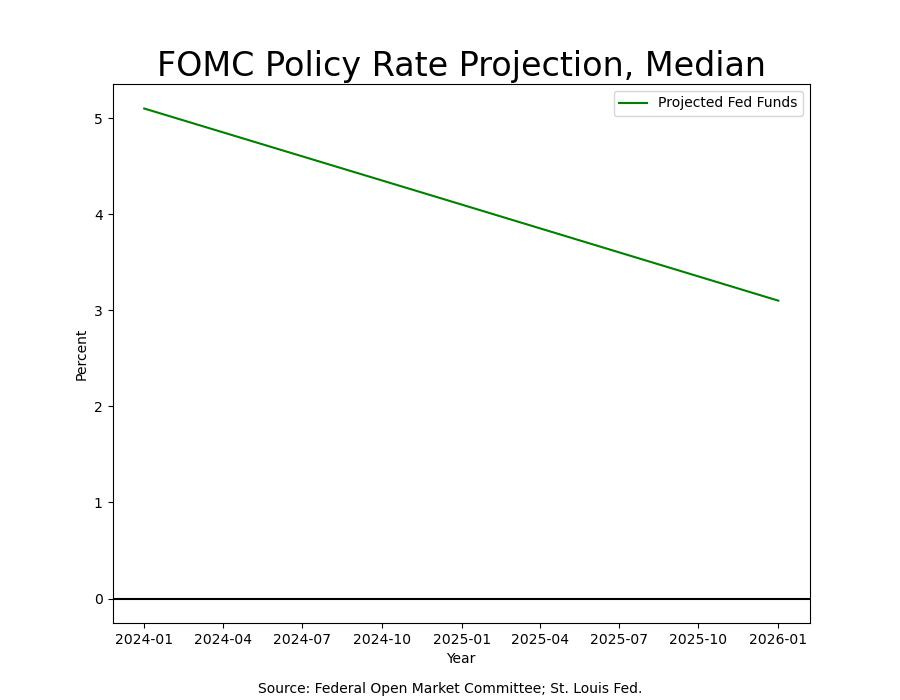
The SEP shows that the Committee generally agrees that inflation will get back down to 2% in 2026. If we take inflation to be 2.7%, then the average monthly decline in the rate of inflation over the next eighteen months would be .15%, about what we saw in May. The average change over the past quarter has been .27%, nearly twice that. So, the Fed is taking May’s inflation rate and forecasting that forward as their base case—although we hear that the projections did not incorporate this most recent data point. Their median estimates for the average policy rate in 2024, 2025 and 2026 are 5.1%, 4.1%, and 3.1%, respectively.
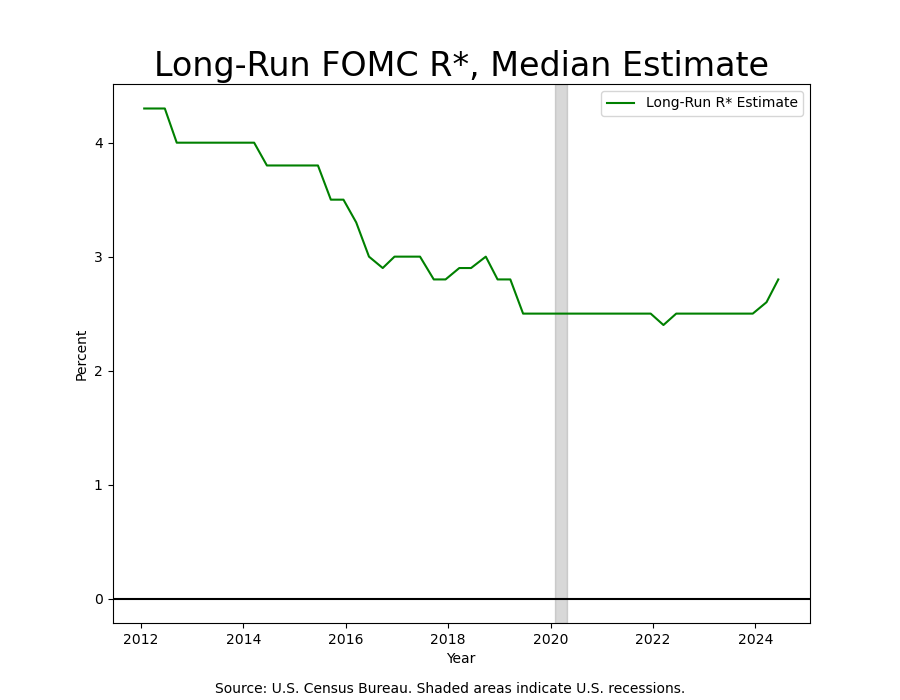
The median policy rate estimates indicate that the FOMC expects two 25 basis point cuts in 2024, four in 2025, and four more in 2026. That implies a future neutral rate of interest of 1% to go with a 2% inflation rate. The Fed is betting not only on lower inflation, but also on lower r*1. However, the FOMC’s estimate for long run r* was increased at the same meeting to about 2.75%, rendering these forecasts problematic.
Something doesn’t jive here, and it’s probably the Fed’s hope that the neutral rate of interest will return to the low we saw coming out of the Global Financial Crisis. The nominal interest rate (5.50%) should be equal to the product of the neutral rate (here, 2.75%) and expected inflation (given as 2%). If the neutral rate is indeed 2.75% as the most recent projections suggest, and if inflation is currently about 2.75% on an annual basis, then that would counsel for a nominal interest rate of 5.50%—which is exactly where the rate is now.
If rates were not restrictive, then we would expect to see real economic growth come in right at its potential rate of growth of about 2%. And that’s exactly what we are seeing. That being the case, one would argue that the dual mandate of stable prices and full employment has been met, and there is no need for rate cuts at all. And this is why the market has repriced to reflect maybe one rate cut in 2024. The math just works at these levels of rates (5.5%), unemployment (4.0%), and inflation (2.8%).
One of our intellectual heroes, Søren Kierkegaard, compellingly writes that “It is really true what philosophy tells us, that life must be understood backwards. But with this, one forgets the second proposition, that it must be lived forwards.” As a friend of goodstead’s recently challenged us, Is interest rate policy really restrictive at these rates; and is there simply too much liquidity in the system for inflation to fall? And that we cannot know until we’ve become future. We can, nonetheless, cast about in the dark with the meagre lamp of our intellect for some illumination of this as yet undetermined truth.
Economic expansions are self-reinforcing. Consumption drives the US economy, to the tune of about 70% of its total activity. The other side of that spending is income, since one person’s spending is another person’s income. That income in turn gets spent, producing yet more income, and so on and so forth absent some exogenous shock that disrupts the cycle. As former Fed Chair Ben Bernanke is fond of saying, “Expansions don't die of old age…they get murdered.”
So, we keep an eye on spending to tell us whether the economy should continue on its current growth trajectory. This is perhaps our best leading indicator, since contractions in spending mean contractions in profit margins, which often (but not always) lead to layoffs and discharges. When workers lose their jobs, or worry that they might, they reduce their spending, which leads to a reduction in income; this reduction in income produces further reductions in spending. Economic recessions, too, are self-reinforcing.
Shifts in the business cycle begin as trickles and quickly become rivers. This is why they are so hard to forecast. Econometric models of demand are themselves engaged in an unwinnable struggle between conservatism bias and recency bias. They are like the angels in Goethe’s heart:
Two souls, alas, are housed within my breast,
And each will wrestle for the mastery there.
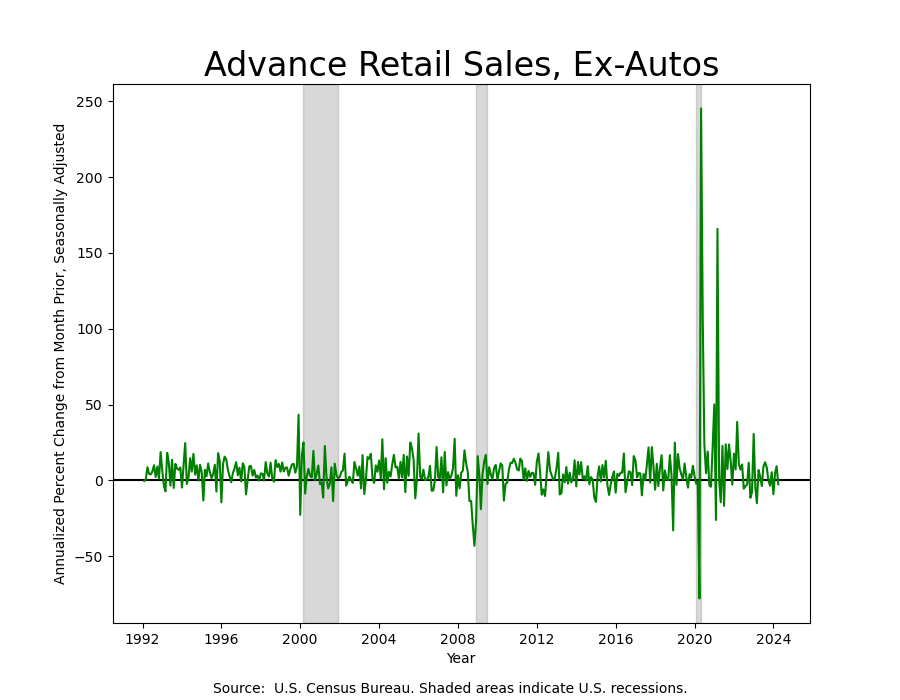
For example, when looking for changes in Retail Sales, do we focus our attention on the annualized rate of change from the past month, which shows contraction:
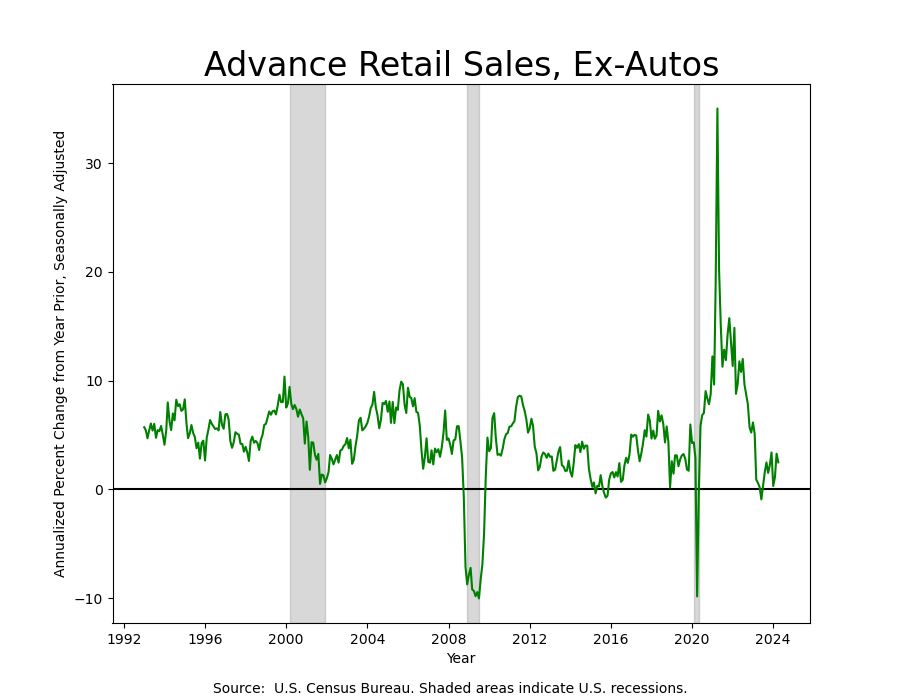
Or do we instead throw our gaze back into the past to see where we are relative to May 2023, which shows a slight decline from an otherwise normal level:
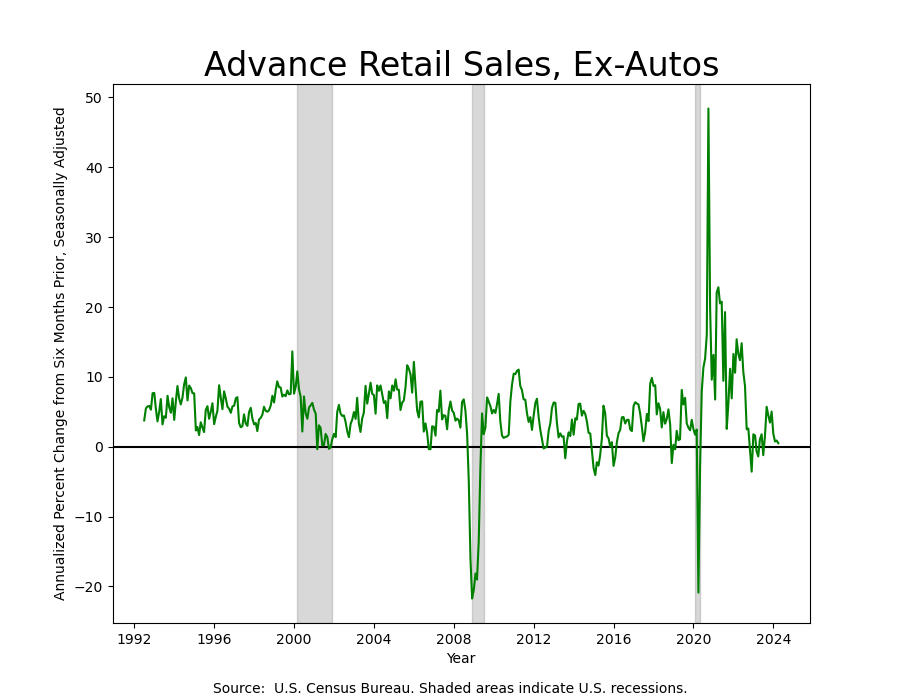
Or perhaps somewhere in between, looking back only six months:
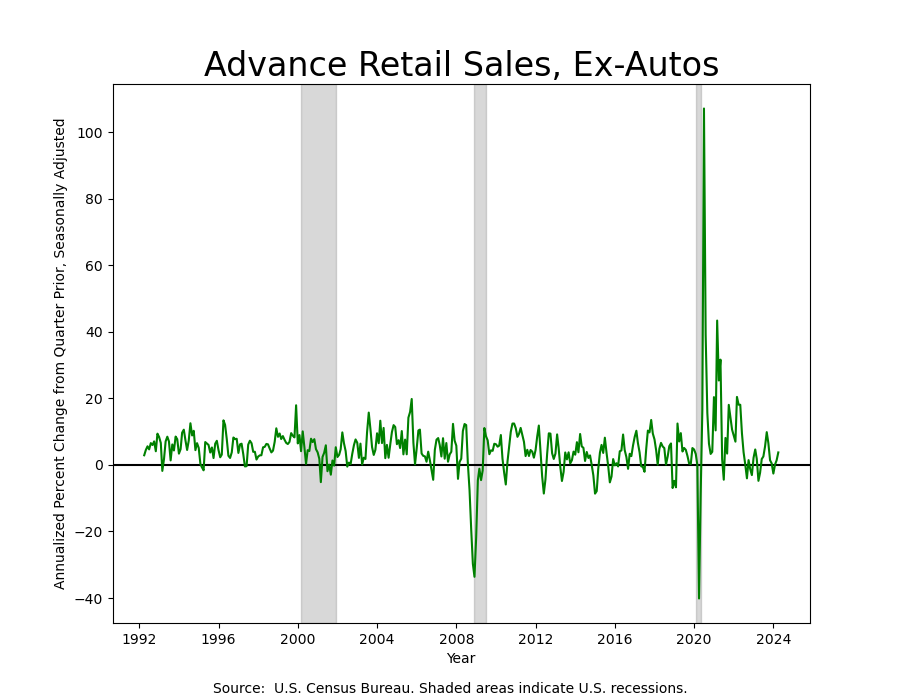
None of these intimate an imminent decline, although the six-month trend is clear—that is, unless you take the three-month trend…
…which suggests recovery. What each of these actually tell us is that retail sales are fine. Consumers don’t appear to be delaying purchases, bargain hunting, or otherwise getting off the hedonic treadmill.
But this is why forecasts can be all over the place and so often wrong. The human brain is seemingly adept at weighing each of these different time scales and arriving at a reasonable approximation of the next point in the series. But doing so across not only a single time series, but across a whole host of different time series is an intellectually herculean task even for the most complex of minds.
This is the most compelling use case for machine learning in macroeconomics, and certainly we are aware of shops that employ this approach.2 The relative importance of these time scales themselves change over time and reflect the unresolvable tension between regime persistence and regime interruption. Those econometric models are best that dynamically adjust weightings as innovations occur, but necessarily will still fail to tell us all that we wish to know about where the economy is headed. The only thing we know for sure is that our forecasts will be wrong.
So, when you hear the Fed tell us that they are ‘data-dependent’, and that they are waiting to see what the data tell them, what they are really saying is that, given the choice between recency bias and conservatism bias, they view conservatism bias as the lesser of the two evils they face.
Producer Prices Surprise to the Downside
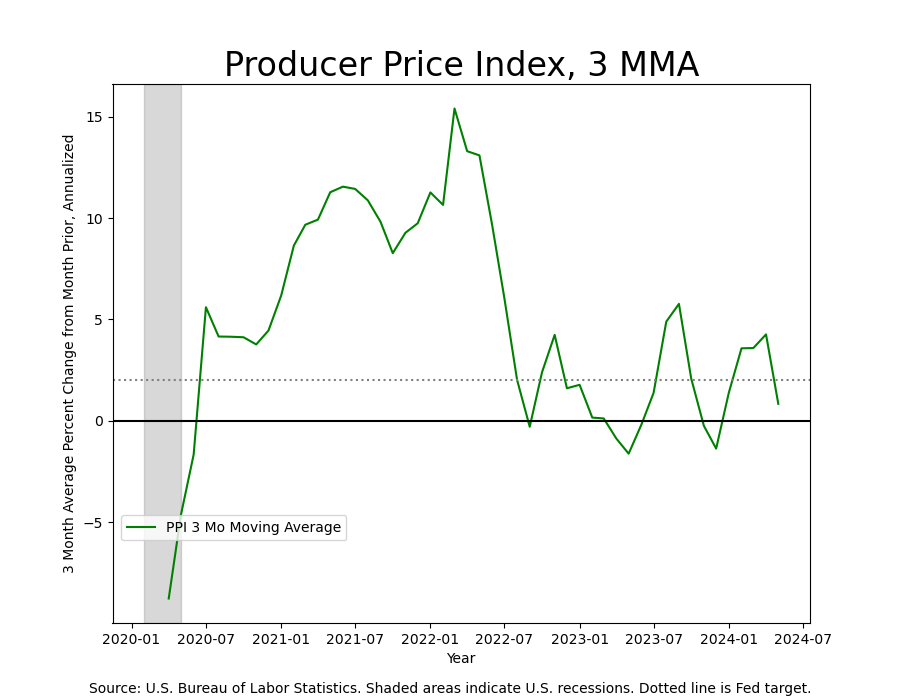
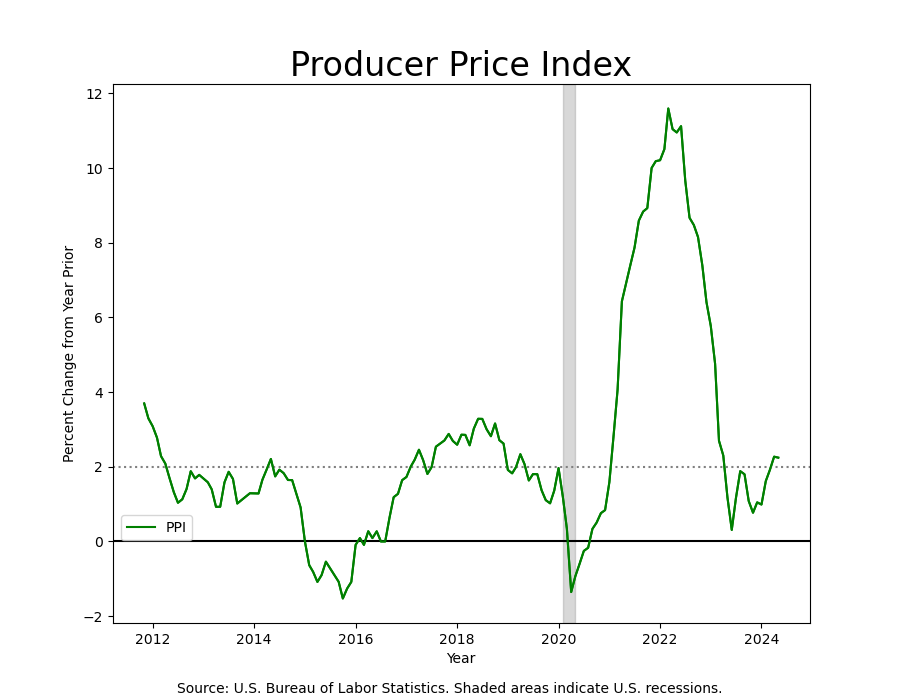
Wholesale prices were down 0.25% month-over-month in May 2024, compared with consensus expectations of an increase of 0.1%. Goods prices fell 0.8%, the most since October 2023. The three-month moving average showed a decline, but the post-2022 average has been bouncing around target.
Year-over-year, PPI is a quarter of a percent off of 2%, after rising readings in January, February, March and April. It was essentially unchanged from April to May.
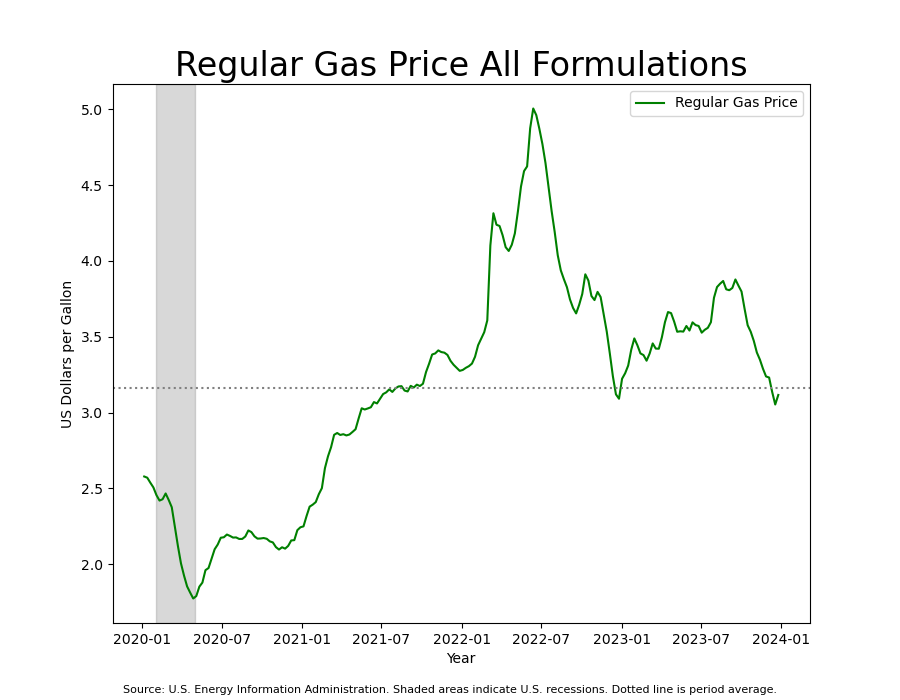
Much of the decrease in May came from a 7.1% decline in prices for gasoline.
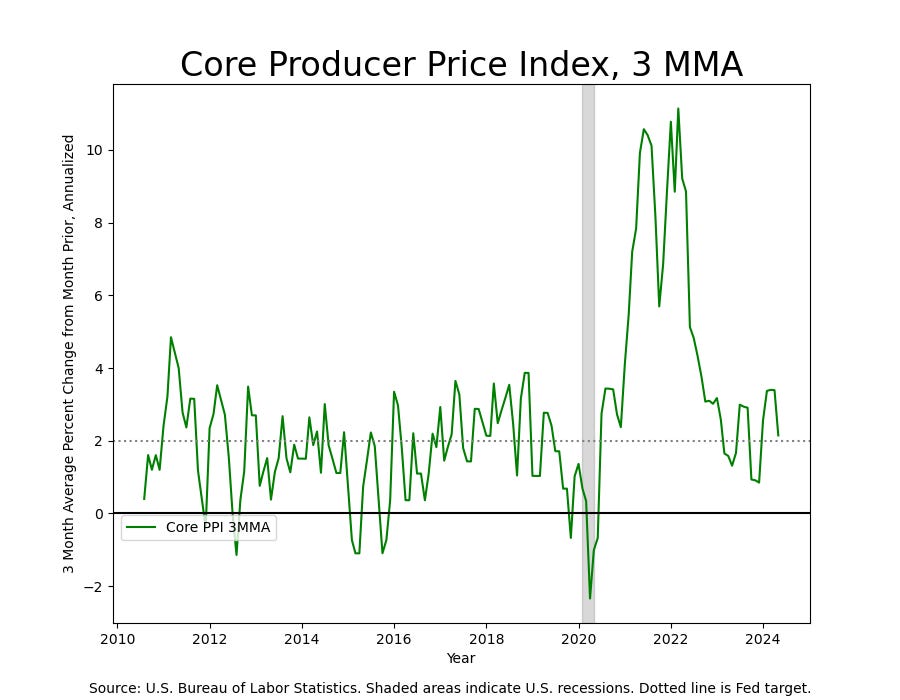
Excluding Food and Energy, wholesale prices were unchanged from the prior month. The three-month moving average shows that the most recent spikes in PPI look pretty normal when compared to the post-GFC period.
With both CPI and PPI in hand, we can pretty confidently forecast the Fed’s preferred measure of inflation, Personal Consumption Expenditures (PCE), which is due Friday. It will likely show a fall in the pace of inflation as well, probably coming in at 2.7%. While we look to PCE for a clearer read on actual inflation, it is also of particular interest because it gives us a window into its eponymous Personal Consumption (spending), as well as Personal Income. These latter two will give us a read on the health of the American consumer, as we get a glimpse into how much workers earned and how much they spent. Since we’re trying to determine the precise timing of the inflection point from holding rates to cutting them, we are especially attuned at the moment to abrupt changes in these measures. Stay tuned.
Labor Market
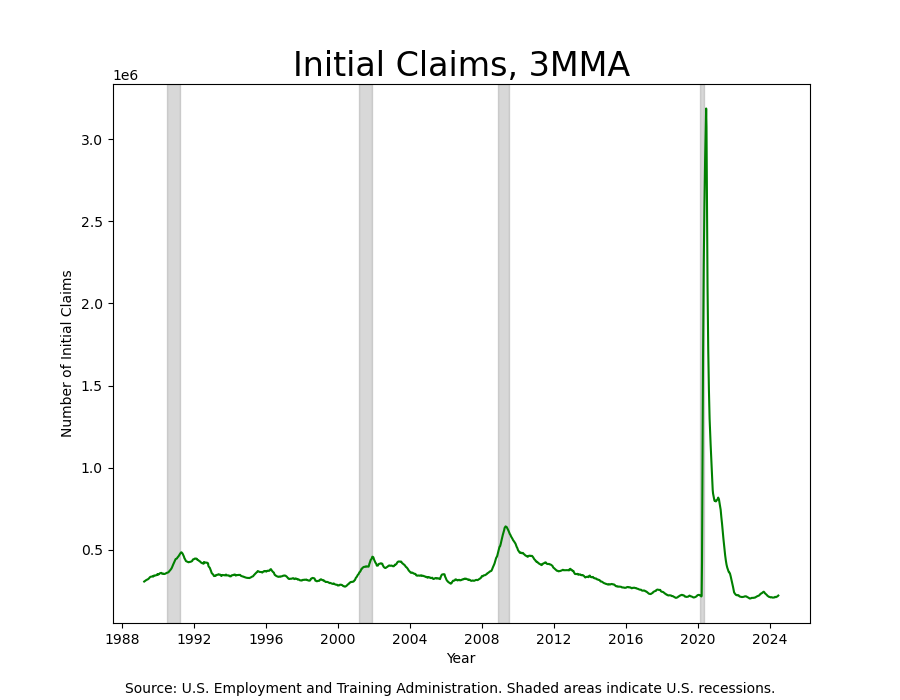
The three-month moving average of Initial Claims increased slightly…
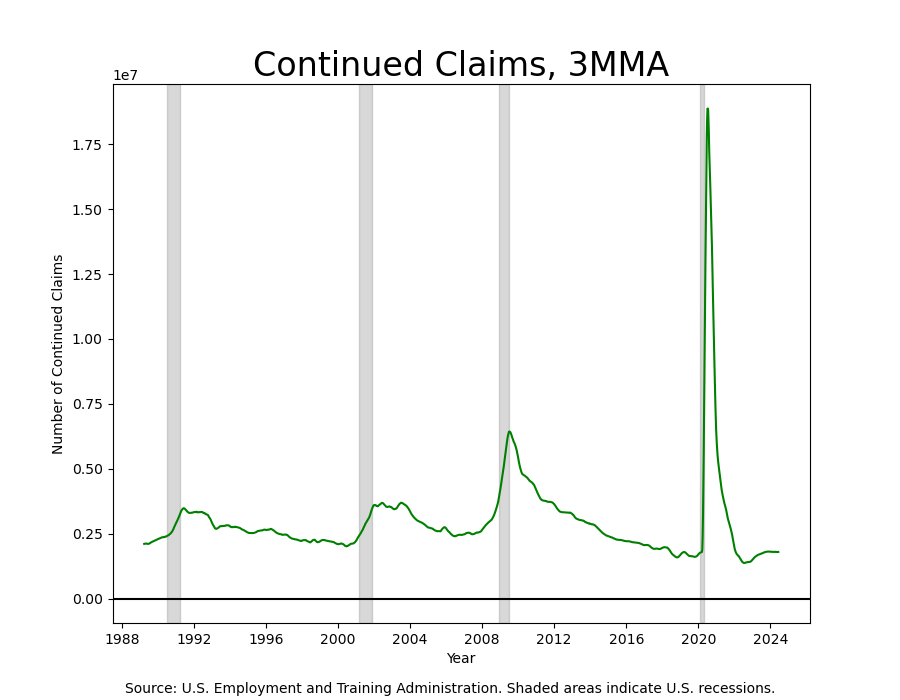
…as did that for Continued Claims…
…neither of which indicate any softness in the Labor Market. Like Retail Sales, the Labor Market isn’t flashing any warning signals.
Housing and Construction
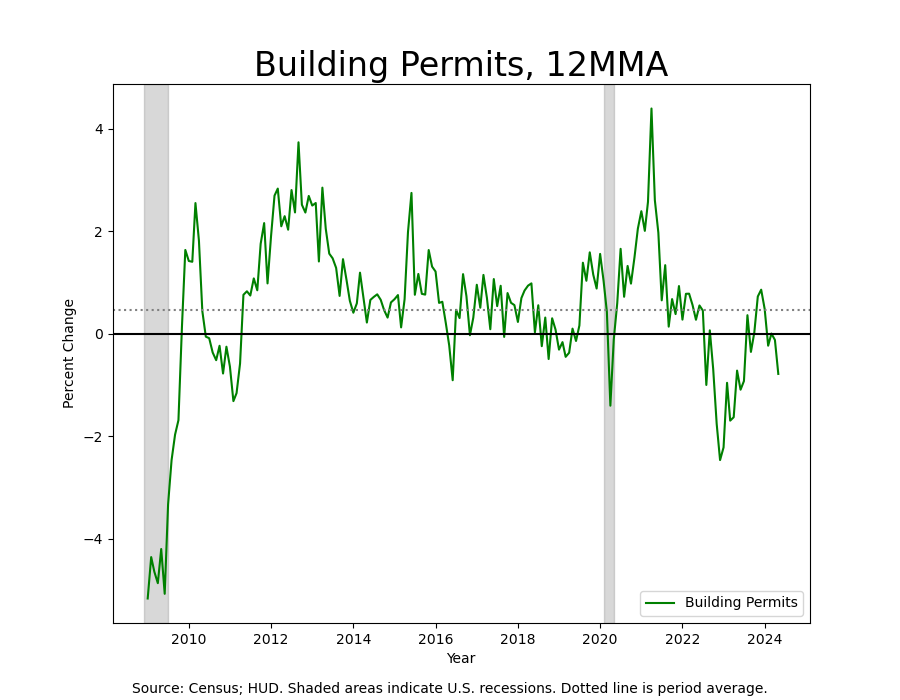
Conditions in the Housing Market continue to deteriorate. First, permits are down, indicating that builders are taking a break from building houses. Builders won’t take out permits to build houses they can’t sell.
Housing Starts, which lag Permits, are similarly down on a 12-month rolling average basis.
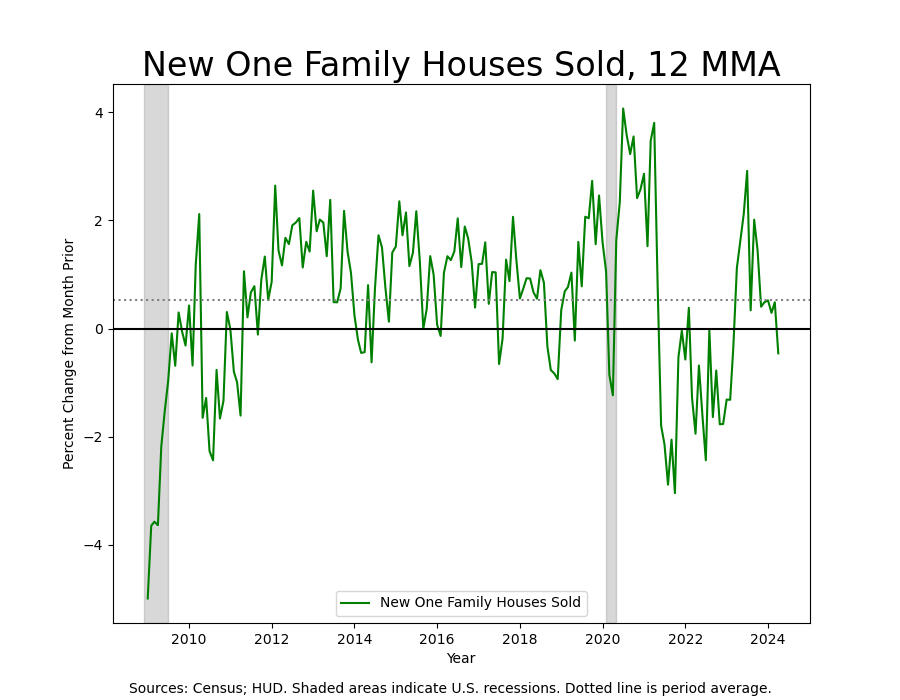
New Home Sales are down for the third month in a row.
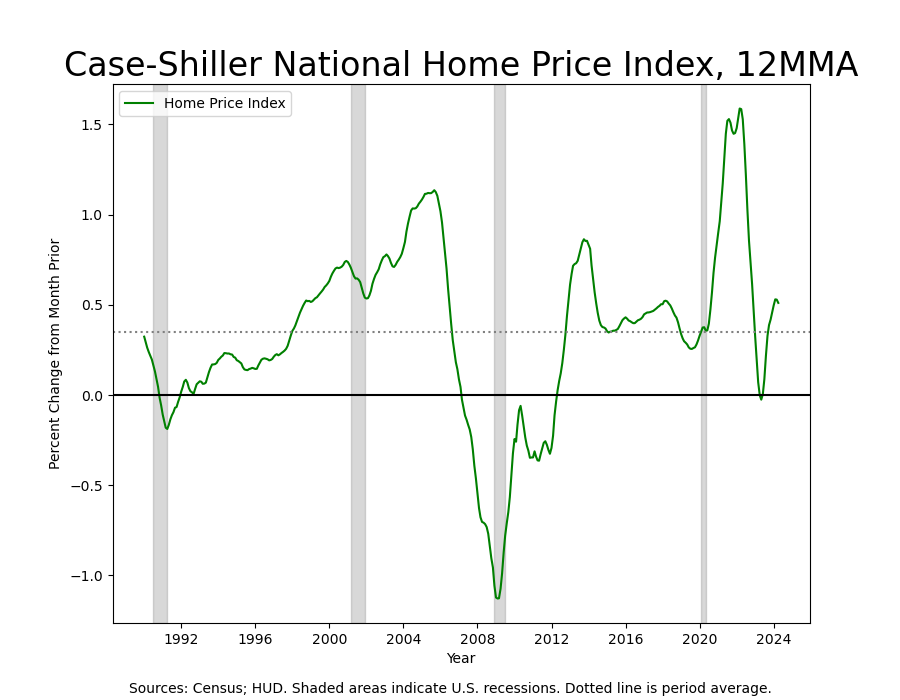
And sales of existing homes are lagging, down a combined 6.3% over the past three months. The biggest problem with the era of ultra-low interest rates is that the low borrowing costs are now a disincentive to moving house. Households won’t or can’t sell because they can’t afford to finance their next home. So, they stay put. This means that the supply of homes on the market is lower than it should be, prices are higher than they otherwise would be, and fewer transactions are consummated than can be in equilibrium. Home prices are still up 7.2% year-over-year, and while they have retreated from recent highs, they have not fallen enough to ease the affordability issues preventing households from transacting.
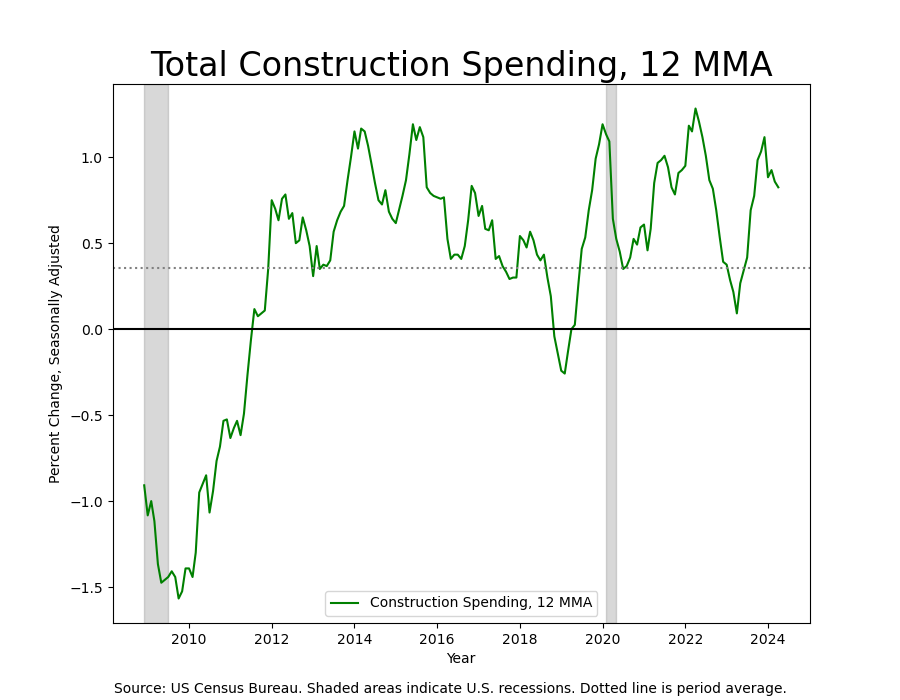
The 12 month-moving-average of Construction spending has been on the decline but isn’t in freefall.
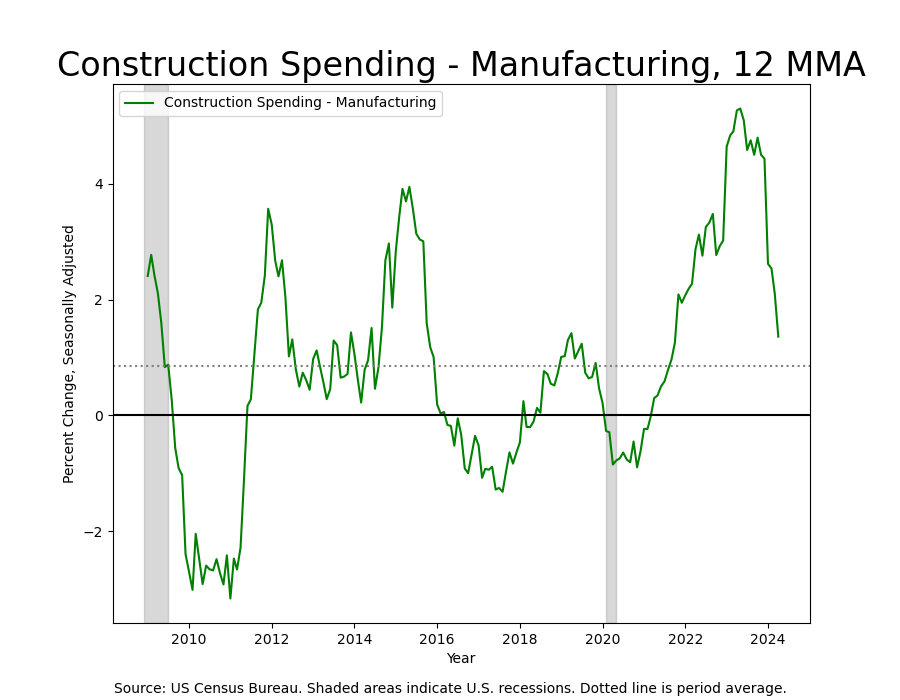
Residential construction has hit a soft patch, but Total Construction Spending remains elevated, especially in Manufacturing.
This is what industrial policy looks like.
Inflation Wrap-up
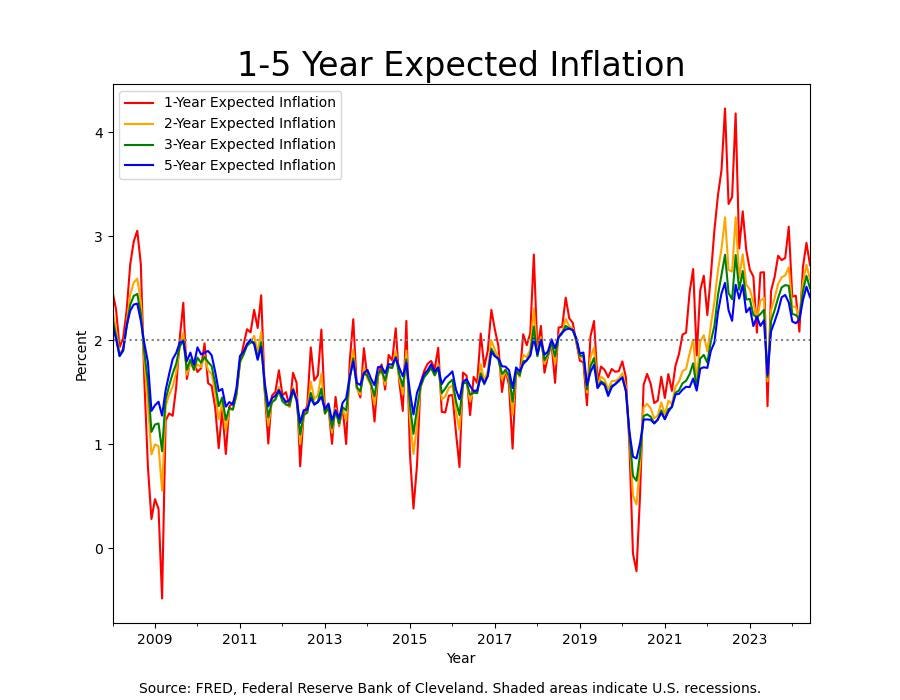
Consumer Inflation Expectations are falling. Two-year inflation expectations are around 2.6%, which are most important for interest rate policy. This would indicate that consumers expect the future to be like the recent past.
Shorter-term inflation horizons are most important for discretionary consumption and savings decisions, whereas longer-term horizons are most important for durable goods consumption and investing decisions. We’ve seen that inflation continues to fall for both small- and large-ticket items, which suggests that expectations are anchored both in the short- and medium-term. Inflation expectations are higher for the short term but aren’t causing the kind of hoard-buying that distorts price signals and becomes self-reinforcing.
All in all, the economy remains in pretty good shape. Inflation, the Labor Market and Aggregate Demand continue to come in, albeit hesitantly. The Housing Market continues to be a drag on the economy, and will be until housing prices fall, the bond yield falls, income rises, or cultural mores change as people seek more square footage in public or privately shared spaces3. Most likely it will be some combination of the four. Real rates are at restrictive levels, and their impact can be observed in the decline in the Housing Market and Durable Goods demand, but overall better balance sheets and growing incomes have blunted interest rate policy’s ability to restrain the overall economy. Rates markets have repriced the timing of interest rate cuts this year and next, which have raised effective interest rates, producing tighter financial conditions that cause the economy to slow.
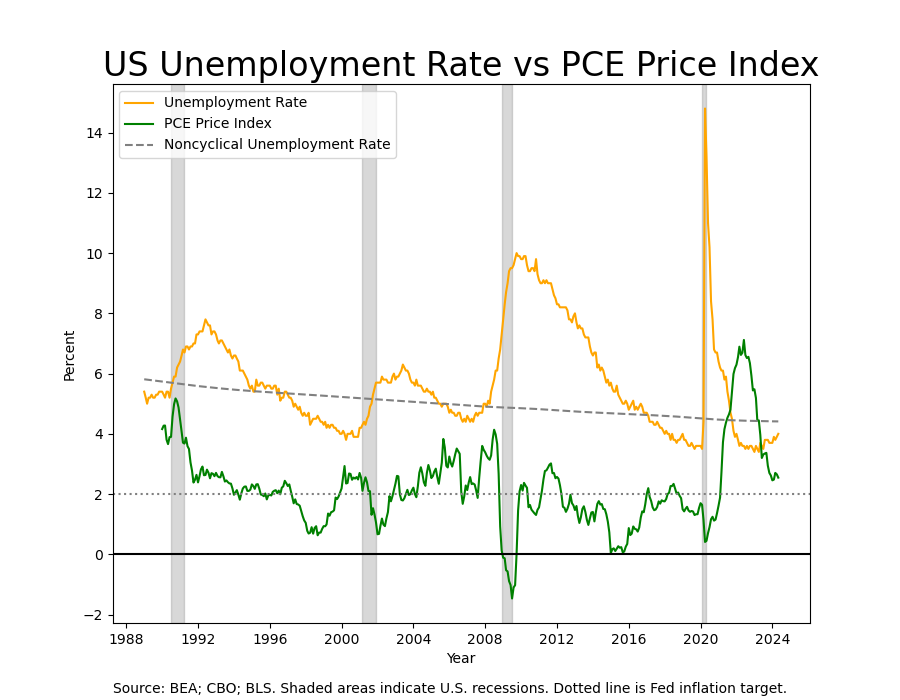
In the first quarter, the Fed was dissatisfied with the progress it had made against inflation. It took a more hawkish tone in its communications, and increased interest rates without actually setting a higher policy rate. In the second half of 2025, we’ll see if these higher rates will be sufficient to quell still-nagging inflation. Looking at Personal Consumption Expenditures and the Unemployment Rate, things sure seem to be heading in that direction.
The neutral, or natural, rate of interest is that interest rate which neither accelerates nor impedes economic activity and would be the interest rate thought to prevail were supply and demand in an economy completely balanced.
We use a variation on this approach in our in-house models, and so are keenly aware of their limitations.
If the increase in demand for residential square footage is due to the rise of remote working and the concomitant demand for home office space, this might be alleviated by the increase of local co-working plant. If the increase in demand is down to an increase in the popularity of group entertaining, then we might expect to see the return of the social club. Or people might just go back to working all the time at the office. Speculation is a fun game.


