"The Fault, Dear Brutus, Is Not in R*"
Why We Are Talking About Talking About Interest Rate Cuts
'With My Crossbow I Shot the Albatross'
A colleague, mentor and friend of goodstead recently provided incisive feedback on our last missive in which we argued that the data that we've received to date are insufficient to compel the Federal Reserve to lower interest rates. We've also focused the meagre light of our analytical torch on how the market is discounting the evolution of the price of money as the economy regains its pre-COVID form and struggles, Atlas-like, beneath the weight of higher interest rates. But we haven't really discussed one of the more pressing arguments within macroeconomics of late: the current level of the natural rate of interest, known as r* (r-star).
In 2018, Federal Reserve Chair Jerome Powell compared interest rate policymakers to mariners who must navigate by the stars to steer the economy1. The two "stars" he references, r* and u*, are theoretical, unobservable values for the equilibrium rate of interest (r) and unemployment (u) that would prevail if the economy were operating at potential and supply and demand were well-balanced. We're naturally sympathetic to nautical metaphors, as much of our marketing employs them, and we enjoy the occasional sojourn by the sea even though we were born and came of age at the foot of the Rocky Mountains, so we will indulge Chair Powell by extending the metaphor.
But before we get into the debate, let's review where we're at so that we can talk intelligently about where we might be headed. Below we show the yield curve on the eve of the Fed's current interest rate hiking campaign (red). In March of last year (green), the yield curve was slightly inverted, while the current yield curve (blue) exhibits slightly greater curvature than it did then. Over the past year short rates have climbed slightly higher, long rates have climbed slightly higher, while the belly of the curve is slightly lower. The short rate is about 5.3%, and the bond yield is about 4.2%. Since 2022 short rates have increased 5% and the bond yield has increased 2%.
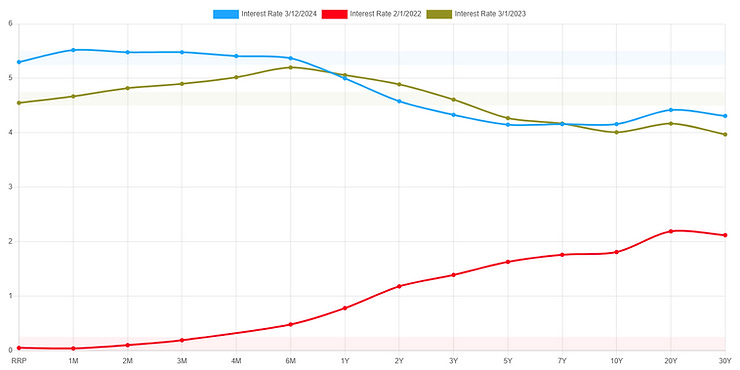
Since US Treasuries are the reference security for all debt issues, new credit is priced as a spread above the Treasury rate. Rises in the yields of US Treasury securities makes borrowing more costly, which is how the Fed transmits its interest rate policy to the market (the interest rate channel). The increase in interest rates has increased the cost of borrowing, thereby successfully arresting the economy's rate of growth.
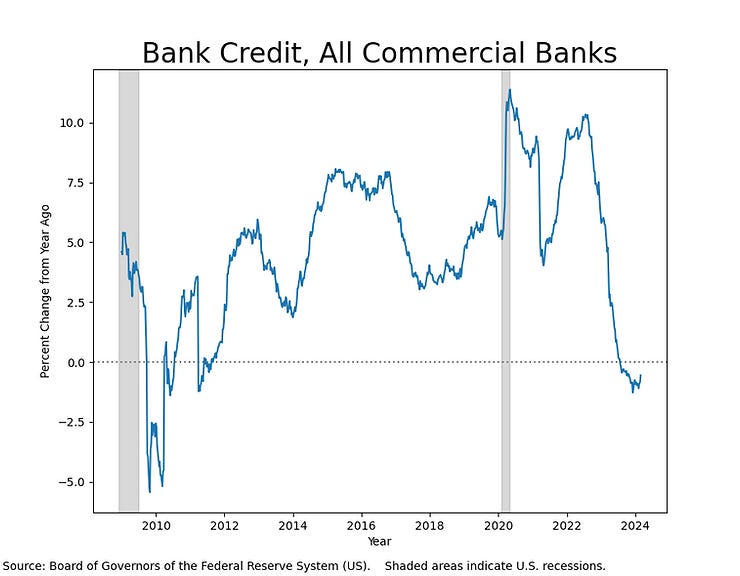
In addition to the interest rate channel, the Fed's monetary policy works through the banks (the credit channel). As the banks' cost of capital increases, the supply of loanable funds decreases, acting as a brake on lending activities. This in turn increases the cost of borrowing to firms, and when something is more expensive, you get less of it. We can see that bank credit continues to contract, though the rate of contraction is lessening.
So the Fed is now pulling growth back to earth as the pilot reels in his unruly kite. Nominal GDP growth, which had soared as the world reopened and its economies awoke from their induced comas, has reverted to its trend rate of growth.
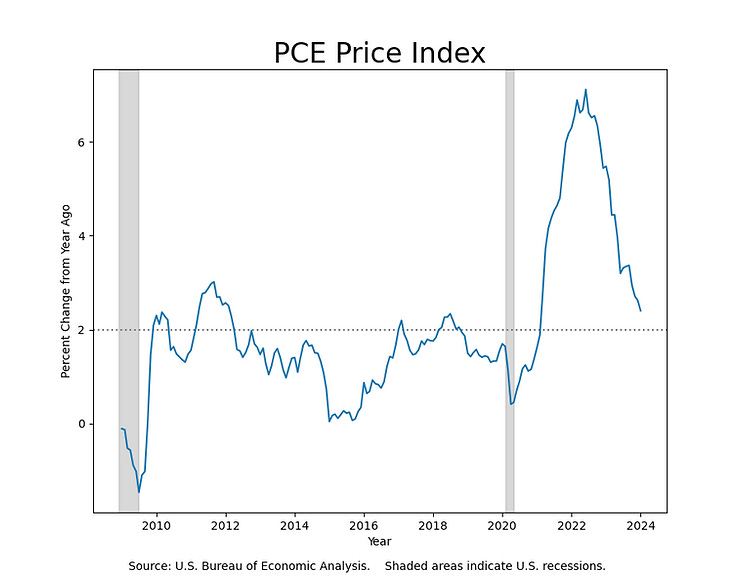
High Nominal GDP growth is great, but if that high growth comes at the expense of an overheating economy, it will eventually result in higher inflation and its wealth-destroying effects. But by any measure, inflation has retreated from the heights it summited in the aftermath of the War on COVID-19 and continues its descent toward the Fed's 2% target rate.
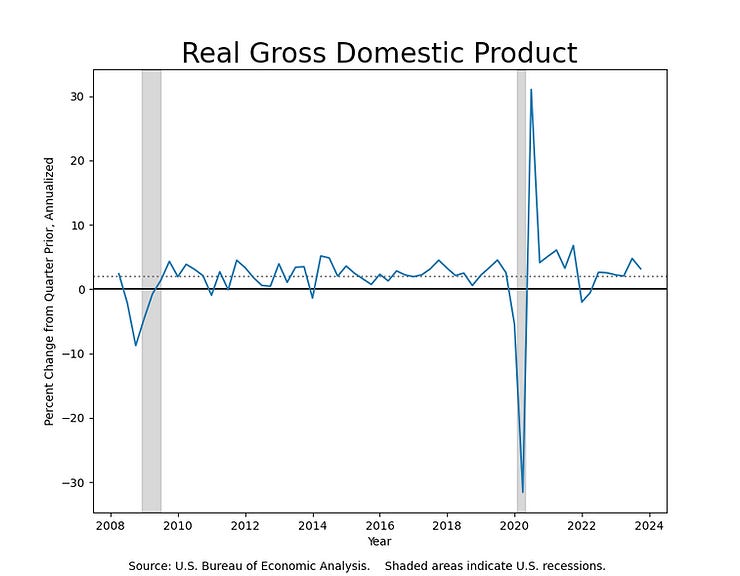
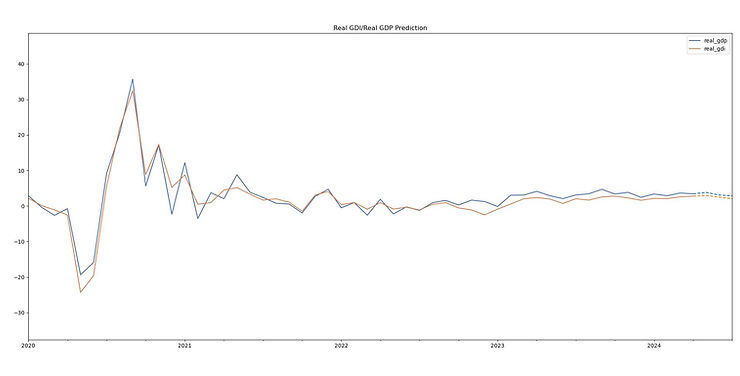
Real GDP growth, or Nominal GDP growth adjusted for inflation, on the other hand continues to come in above the post-Global Financial Crisis average. Real GDP growth that comes in above the trend rate of growth and is accompanied by disinflation is a sure sign of the impact of technological innovation.
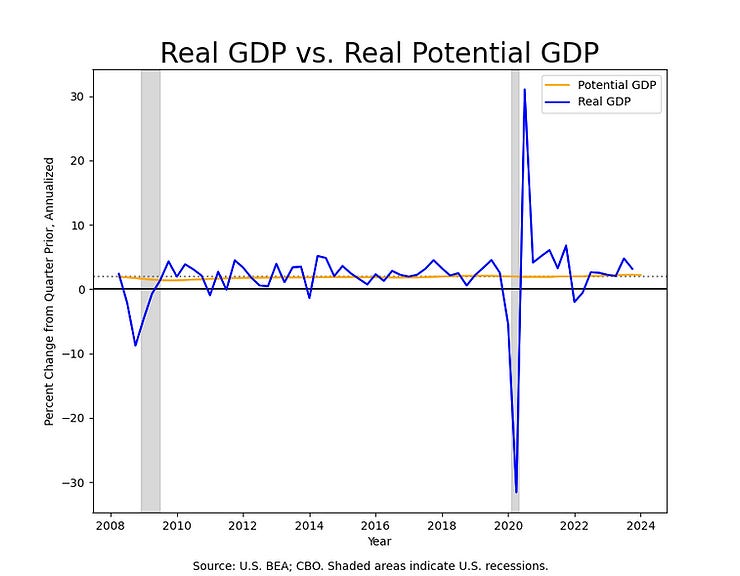
When we examine the economy's performance with respect to potential GDP growth, we see that Real GDP growth is running above potential--therefore, potentially inflationary--but not by much. However, overlaying the post-Global Financial Crisis trend rate of growth over the CBO's estimate of Potential Real GDP, we can see that the CBO's estimate essentially admits that its forecast is that the future will look like the recent past--a surprisingly prevalent assumption.
We don't have the data yet to suggest that we're in a different economic regime, but recent relationships between growth and inflation are not consonant with those observed over the past fifteen years. As we've written before, we observe more similarities between today's economy and that we observed in the nineties: high growth, falling (but elevated) inflation, and falling unemployment.
As we say to the students in an Economics class we teach, what would you do if you were a member of the Federal Open Market Committee, the interest rate policy-setting organ of the US Central Bank? Real GDP Growth is positive, it exceeds potential Real GDP, and is seemingly disinflationary nonetheless--what's left for an Ancient Navigator to do but go home to the Federal Reserve easy chair, crack a beer, and drink a toast to a job well done?
''Twas Right, Said They, Such Birds to Slay that bring the fog and mist'
The issue is, of course, as Kierkegaard writes:
[L]ife must be understood backwards. But with this, one forgets the second proposition, that it must be lived forwards.
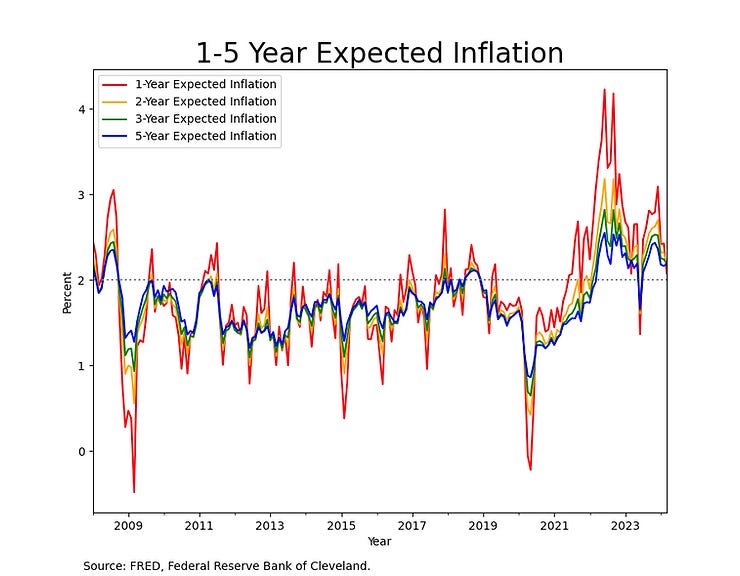
The data are useful to inform us of where we have been but are not fit for purpose to tell us where we are going. We don't drive looking in the rear-view mirror. The market has responded to the taming of inflation and expected rate cuts with fits of rapture and have marked risk assets higher. We now see risky assets trading at record prices in a sign of confidence in the economy. But too great an increase in aggregate demand can cause price pressures to reassert themselves and spoil the party before it really gets started. We look at forward estimates of inflation to determine whether we should be worried about future inflation or not. Based on expectations of future inflation, it would appear that we've already seen the second spike in inflation.
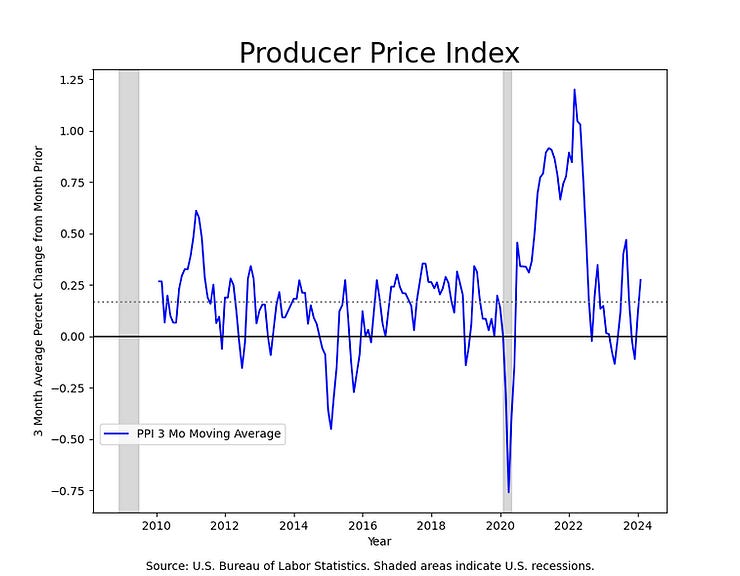
Measures of 1-, 2-, 3- and 5-Year inflation are just north of the 2% target, a good sign that inflation expectations have normalized. While this is certainly encouraging, we should nonetheless examine the data on pipeline inflation to see if inflationary pressures are mounting, but have not yet flowed through to consumers in the form of consumer prices. The Producer Price Index is one step ahead of the Consumer Price Index, as it provides us information on wholesale prices for commodities as well as for capital goods.
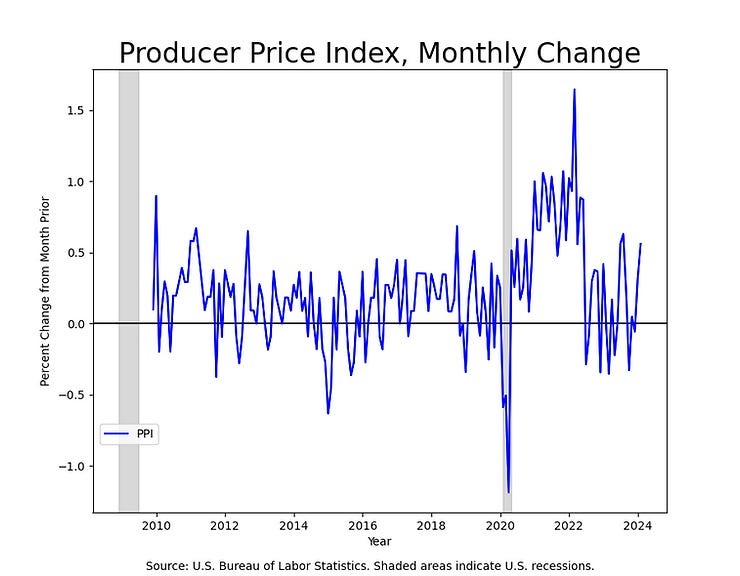
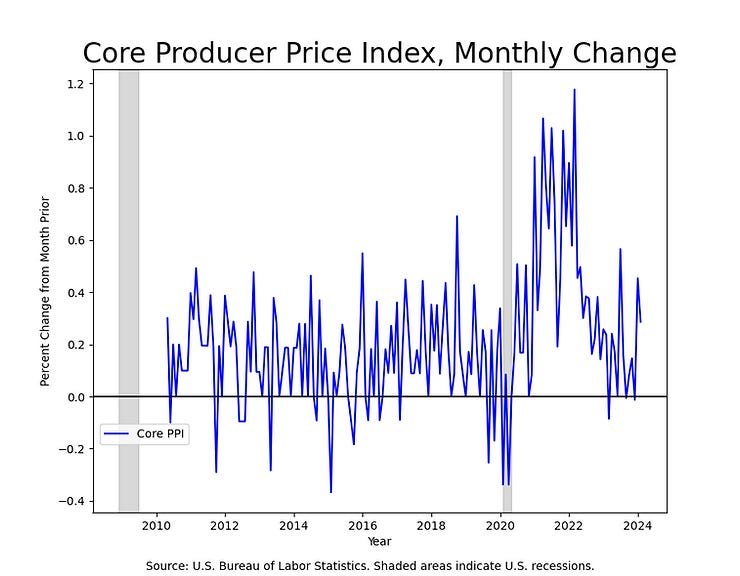
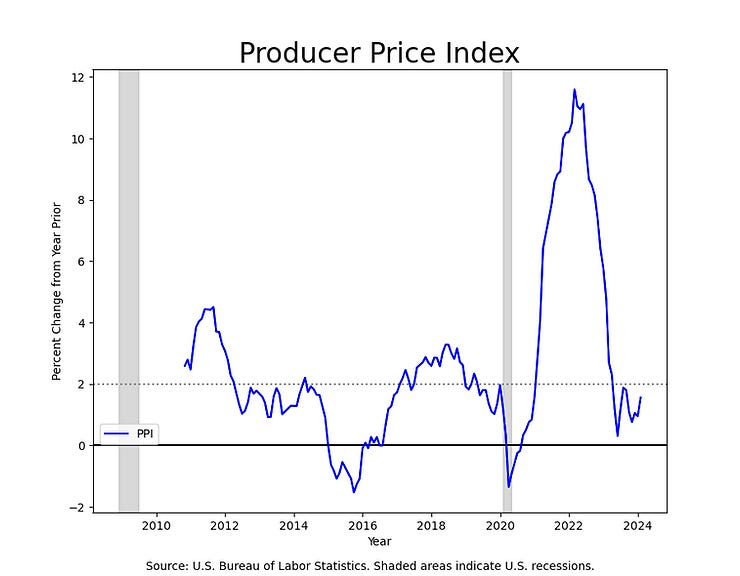
On news that the PPI was .56% higher month-over-month, markets quickly repriced security prices out of fear that inflation was reaccelerating. The higher reading enlarged the shadow of doubt lurking in the minds of investors from January's CPI reading, and as a consequence the markets sold off. This was despite a higher, but not wildly so, Personal Consumption Expenditures reading just a couple of weeks prior. As you can no doubt see in the chart above, PPI is a quite volatile measure of inflation on a month-to-month basis. When examining the same measure for Core PPI, which excludes volatile food and energy prices, a different picture begins to emerge.
Core PPI showed a month-over-month change of only .3%--when annualized, this exceeds the Fed's 2% target clearly, but is plainly consistent with other measures of inflation we've seen that suggest elevated price levels, but not rapid reacceleration. Looking at the year-over-year change, we see that PPI is actually below the 2% target.
As always, looking at trends is often the sagacious approach, as short-term readings are given to exaggerated change. Perhaps the year-over-year change tells us more about where we were than where we are, so we consult the three month-moving-average to determine whether pipeline inflation is mounting.
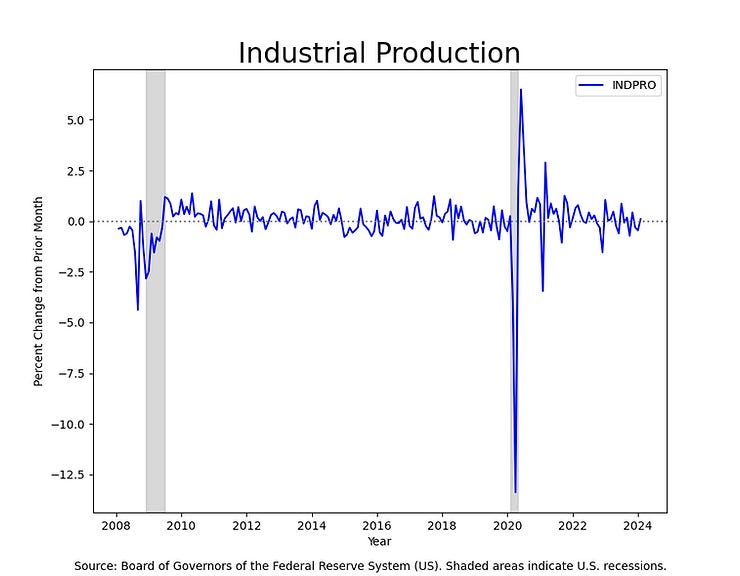
Pipeline inflation is elevated, but off of a contraction, and not by much. All in all, the market's kneejerk reaction to the higher number was overdone, especially in light of what's happening in Industrial Production, which shows no signs at all of overheating--in fact, it shows us only a small gain of .1%.
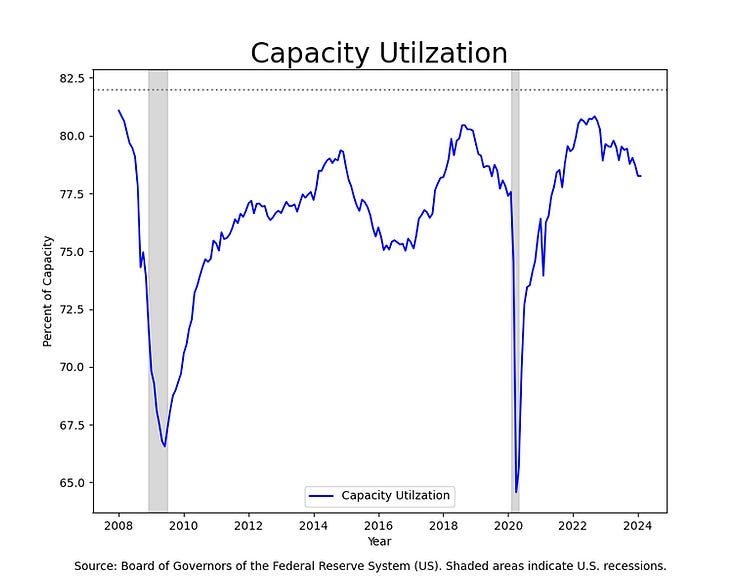
Similarly, Capacity Utilization has been trending downwards. Late in the business cycle, additional increases in demand are inflationary because they run up against capacity constraints, typically in the 80%-and-higher range. But we see that firms have spare capacity, and so this current level is unlikely to presage resurgent inflation.
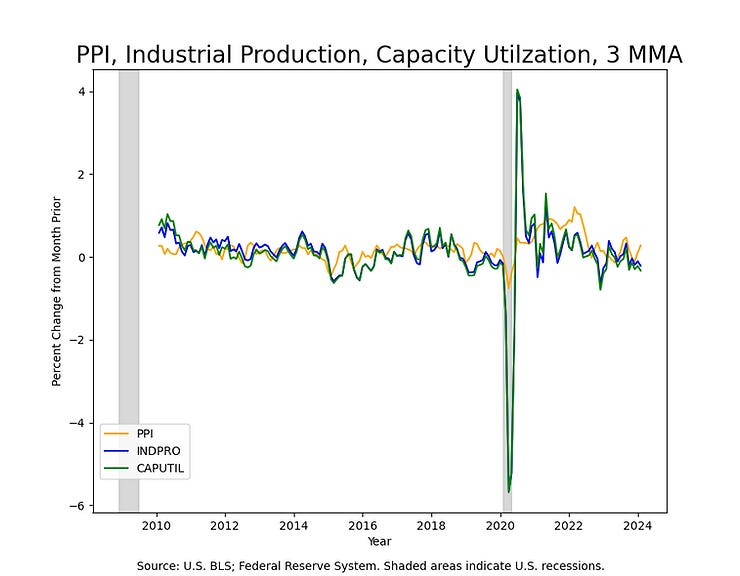
Tellingly, if we overlay PPI over Industrial Production and Capacity Utilization, we see that PPI registered a quite unusual movement compared to Industrial Production and Capacity Utilization. If the economy were running at inflationary levels, we'd expect to see these moving in the same direction. That they so clearly are not leads us to believe that the PPI data should follow Industrial Production and Capacity Utilization downward in the near future.
'Instead of the cross, the Albatross about my neck was hung'
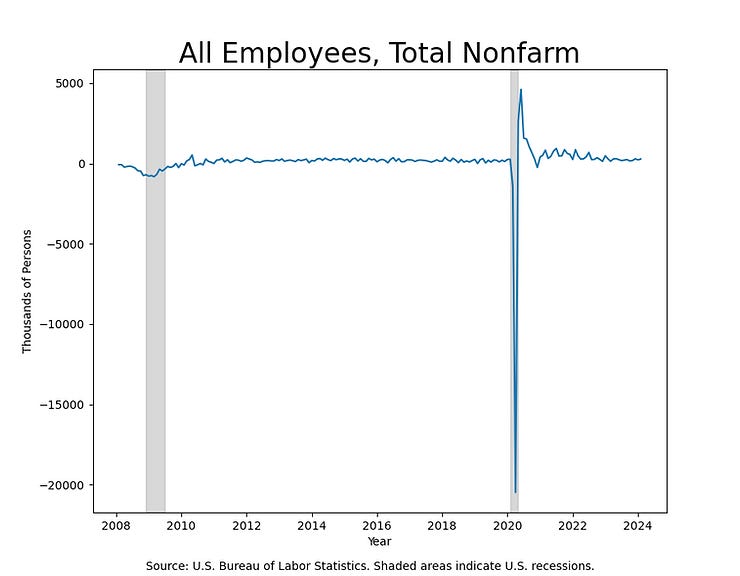
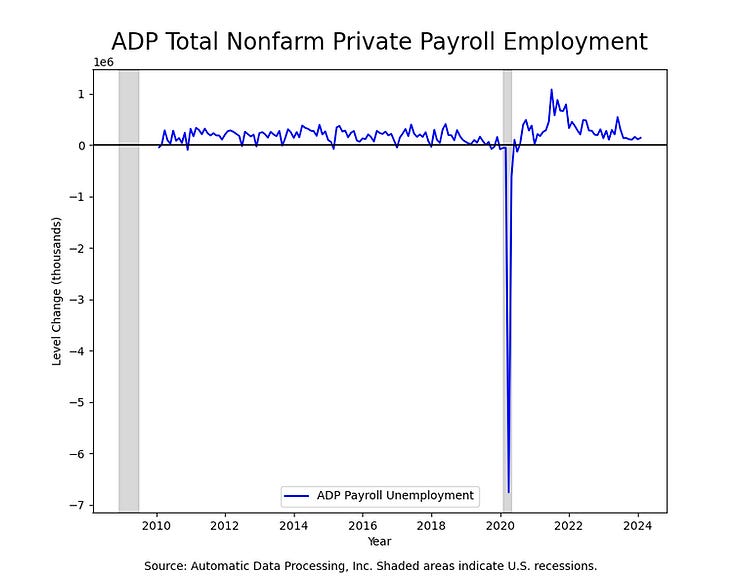
Nonfarm Payrolls, one of the indicators that had been really off the hook lately, expanded as expected in February--and while this is a sign of a strong economy that continues to grow, gains for the two months prior were revised downward. Non-Farm Payrolls showed strong growth in February, as expected, expanding 275,000. January's 353,000 new jobs were revised down to 229,000, leaving the three-month average at 265,000. Expectations were for 200,000 new jobs. 180,000 new jobs per month is generally consistent with an expanding economy, so this is healthy job growth. ADP's Private Payrolls survey showed payrolls increasing by 140,000, while 150,000 were expected.
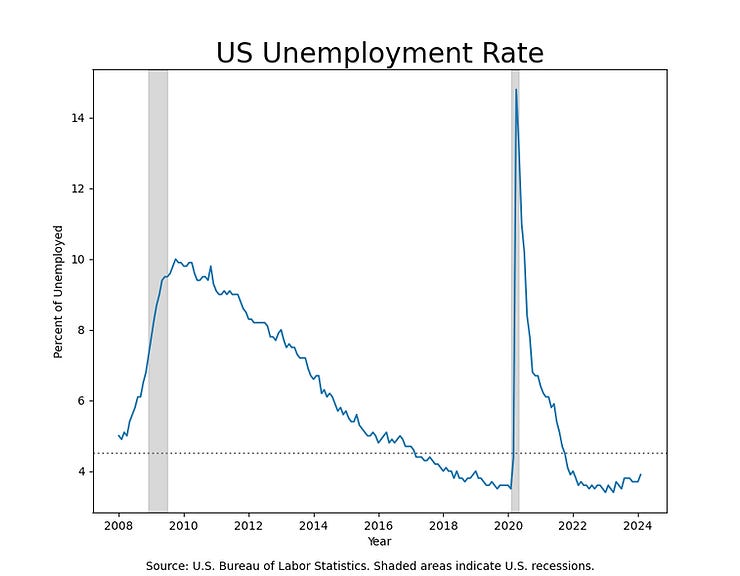
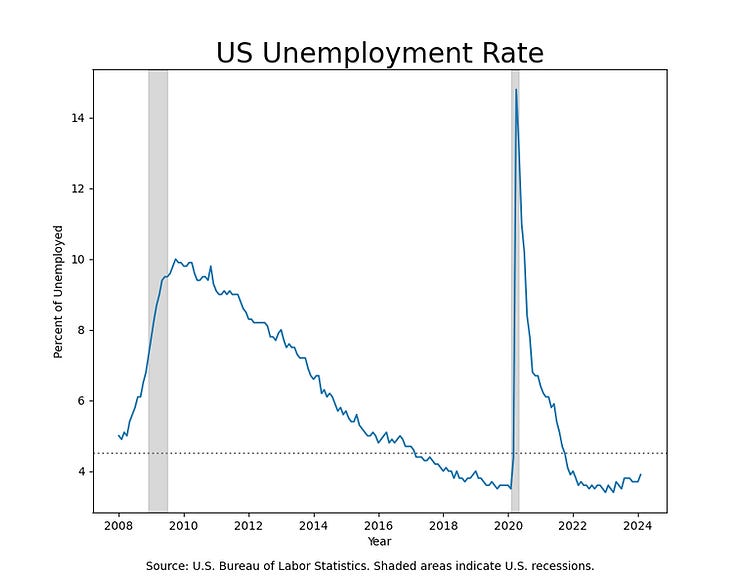
Nonetheless, the Unemployment Rate rose slightly, increasing .2% from 3.7% to 3.9%, higher than market forecasts of 3.7%. The number of Unemployed increased by 334,000 to 6.5MM persons, which is the highest reading since January 2022, when the unemployment rate was 4%. Downward revisions to jobs numbers and a (slightly) higher unemployment rate portend the deceleration in economic growth we've been forecasting.
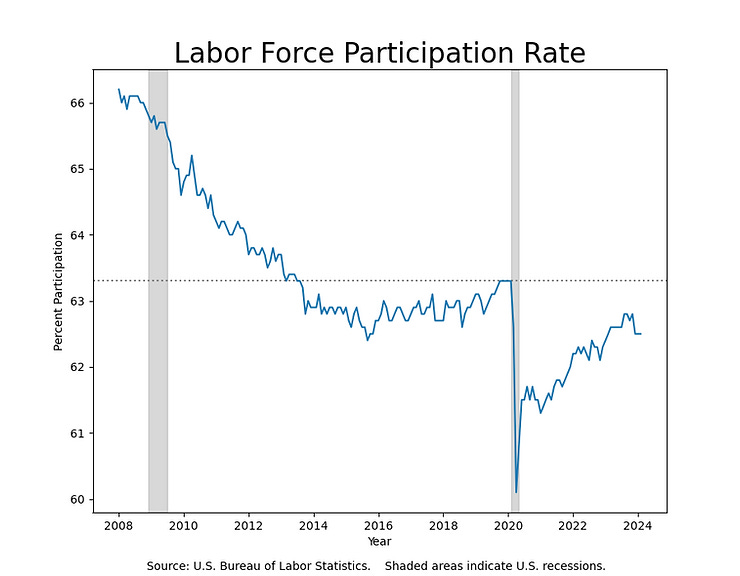
The Participation Rate held steady at 62.5%. This rate remains .8% lower than the eve of Covid-19 Pandemic, and is .3% off since November 2023. A long-term headwind for the economy, Participation peaked at 67.3% in February of 2000. Given that 10MM new immigrants have arrived over the past couple of years, some of whom have unofficially joined the economy, could we be undercounting immigrants in the informal economy?
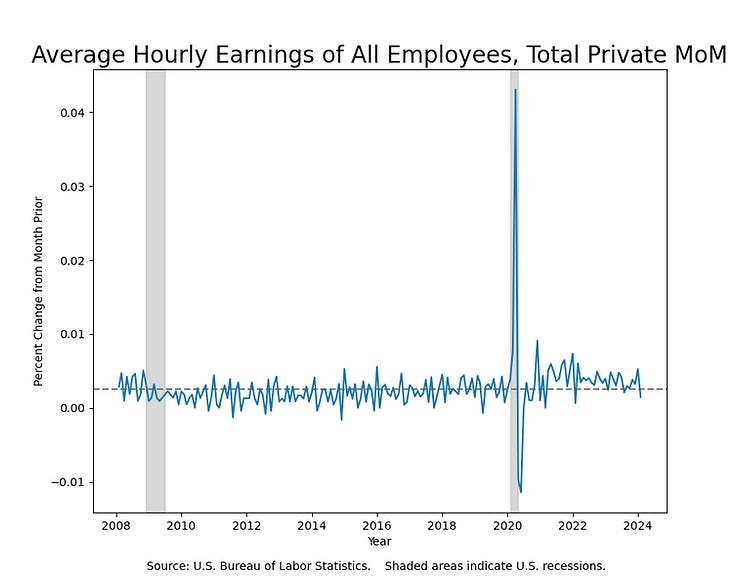
The growth rate of Average Hourly Earnings fell on a month-over-month basis, signaling a momentary relaxation in the wage rate's upward momentum...
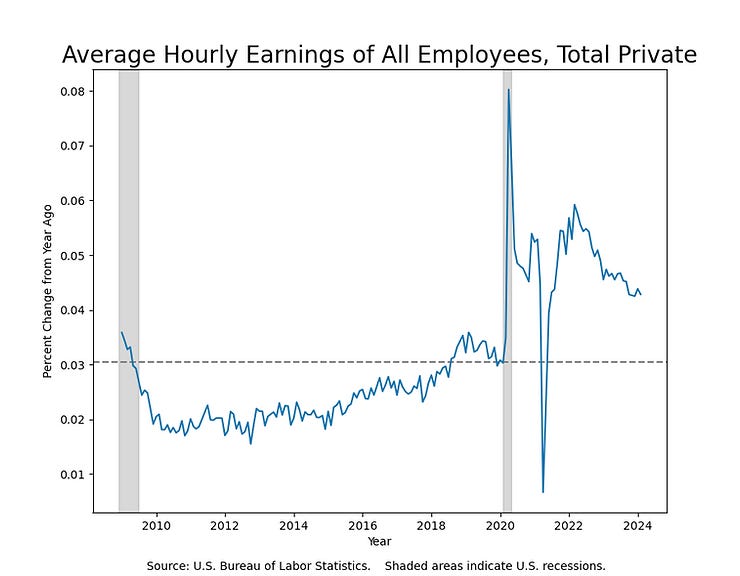
...and was lower on a year-over-year basis, as well.
Of those measures of price change most inconsistent with a 2% rate of inflation is the growth rate in the price of labor the rate of wage gains is no. 1. It is far too early to see any progress here, but the trend downward belies the upward trend in other prices.
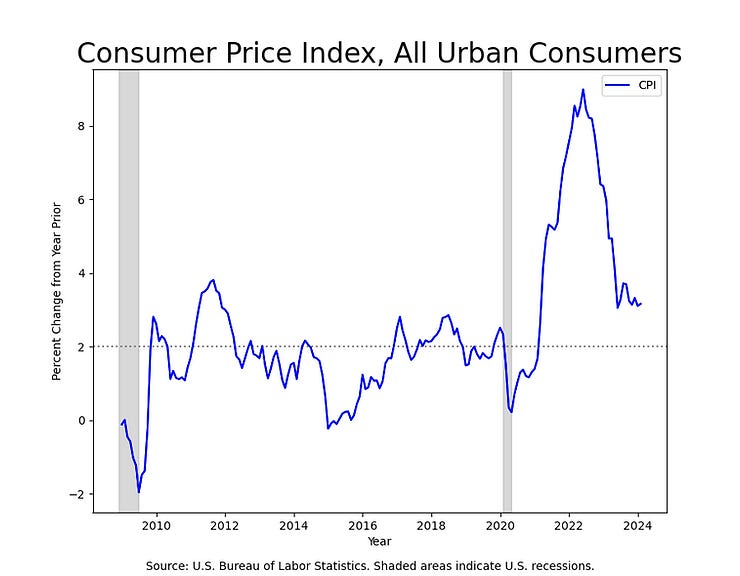
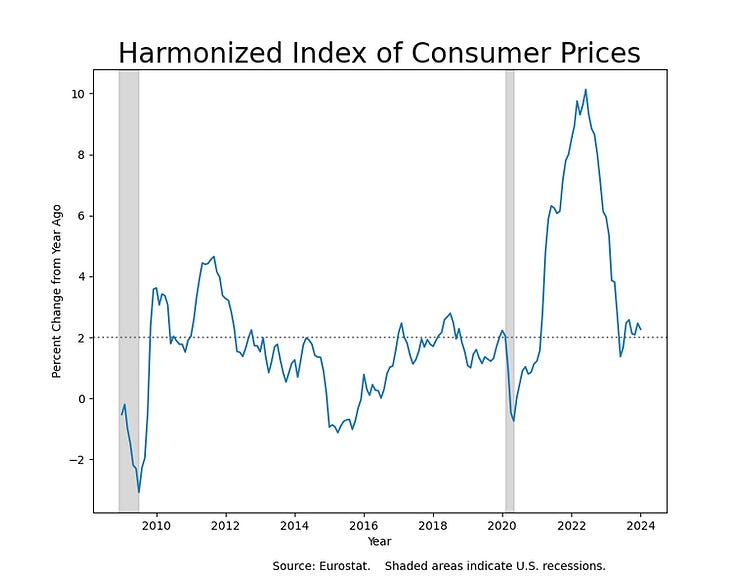
Last Tuesday, the Bureau of Labor Statistics released its Consumer Price Index. On a year-over-year basis, Consumer Inflation still looks pretty good at 3.2%. This was in line with expectations of a stall in the decline of the inflation rate.
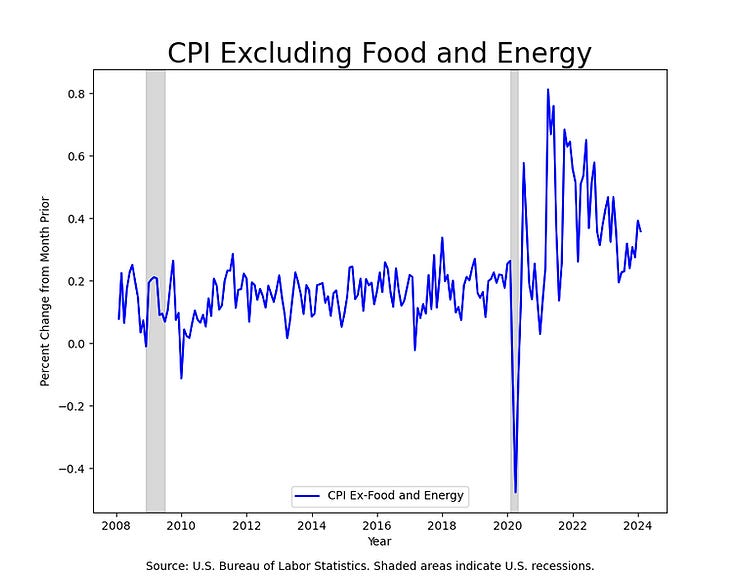
Month-over-Month, Core CPI came in at .36%, a slight decrease from January, and in line with forecasts. That annualizes to an inflation rate in the mid 4.4% range.
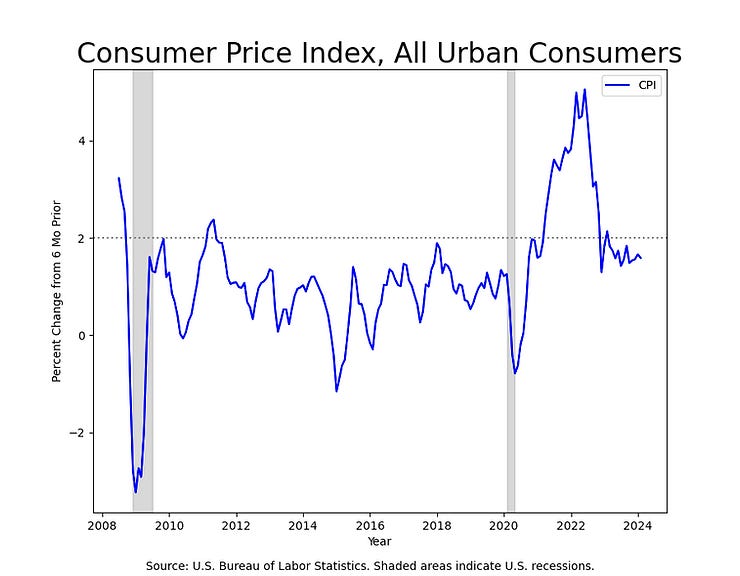
As we mentioned earlier, year-over-year measures probably tell us more about where we were than where we are, so we examine the six-month change in the price level. We get a better view on price pressures when looking at nearby rates. The six month-over-six month shows a rate below 2%--and still falling.
Further, the CPI is affected by a rising price that no one pays: Owner's Equivalent Rent (OER). Nearly 40% of the monthly expenditure for an average American family consists of the cost of shelter, which has been rising. Although rents have been falling, most Americans own their homes, and with 30-year fixed rate obligations, are insensitive to the rise-and-fall of the cost to rent. In order to include the cost of shelter in the CPI, BLS asks these non-renters what they would pay to rent their own homes from themselves. This is neither an arms-length transaction, and one that is tied up in emotional bias. Excluding this input, the rate of inflation is still elevated, but shows that the Fed's interest rate policy has done what it's supposed to do: arrest the rate of growth rate of the economy.
In Samuel Taylor Coleridge's The Rime of the Ancient Mariner, the Mariner's crew first ridicules the Mariner for killing the albatross who had broken the ice that had bound their ship. Its death is near concomitant with their release from the frozen seas and escape into quiescent, sunny ones, and so they come to congratulate the Mariner on his excellent choice of target, confusing the murder of the providential seabird with their deliverance. However, when the winds die and the crew bake in the hot sun of a still sea--suffering unslakable thirst in the midst of an ocean--they turn to blame the Mariner, and tie the bird about his neck.
Prince Jerome the Navigator
As growth has slowed, the markets have rallied, believing that the Federal Reserve will turn imminently to cutting interest rates. Inflation continues to trend downward but isn't yet low enough to allow the Federal Reserve to cut interest rates with the confidence that it won't have to raise them again to fight a second bout of inflation. Since inflation has seemed to rally over the last two months, the market has pivoted from pricing in six or seven interest rate cuts in 2024 to just three now; furthermore it has pushed expectations of a first cut to June at which point the market is pricing in a 63% likelihood of a cut, or to July, at which point the market is pricing in an 80% chance.
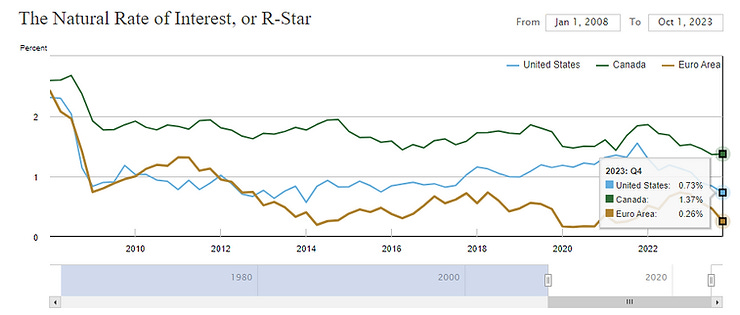
The question of when, and whether, cuts will come is based on what Jerome Powell and the Federal Reserve Open Markets Committee believe are the right values for the two stars they use to navigate the open waters of monetary policy, r* and u*. Theory used to have it that these were, as Caesar's will, constant as the northern star: "natural rates" that inhered to an economy. Now the academic and policy consensus is that they change over time and have been declining in developed economies due to some mix of demographic, social, political, technological and trade-imbalance reasons. The level matters for monetary policy. To slow an economy, it is necessary to increase the level of the real interest rate, which is the nominal (published in the newspapers) interest rate minus the inflation rate, to a level above the neutral rate of interest, r*. If, as has been suggested, the neutral rate of interest is now higher than it was pre-COVID-19, then it would take a higher level of nominal interest rates to put the brakes on the economy.
So, to determine how restrictive interest rate policy currently is, we would take the nominal interest rate--say, 5.3%--and subtract the current inflation rate--say, 2.1%--to derive a real interest rate of 3.2%. We then subtract our estimate for r* of .73% to obtain a 2.5% interest rate restriction. That's a substantial hurdle for the economy to surmount to continue to grow apace.
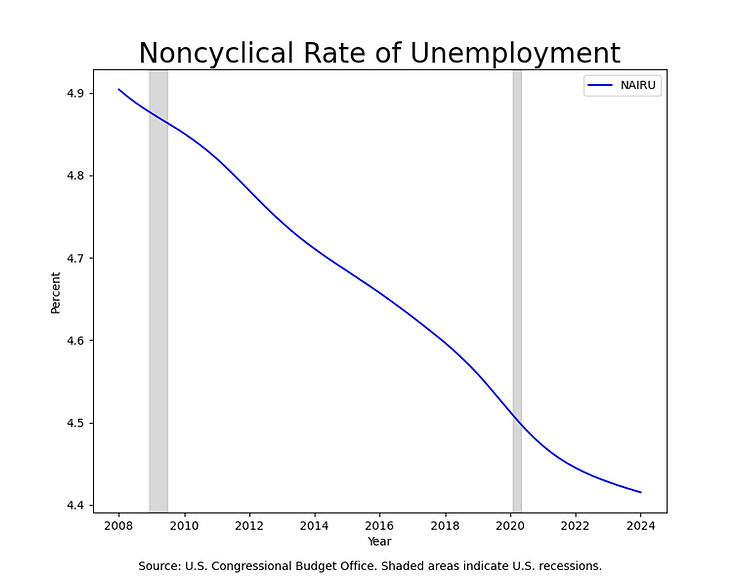
The other star that the Federal Reserve navigates by, u*, used to be referred to as the natural rate of unemployment, but is now known as the Noncyclical Unemployment Rate or the Non-accelerating Inflation Rate of Unemployment (NAIRU). It's assumed to be the rate of unemployment when everyone who wants a job has one, the rate consistent with full employment and below which inflation rises.
The Unemployment Rate has been below what is assumed to be u* since October of 2021, yet inflation hasn't been increasing as the theory would suggest. This has to do with another debate that I don't want to get into here, which concerns something called the Phillips Curve. Suffice it to say that what we think we know about the relationship between the inflation rate, the unemployment rate and the wage rate is being revisited. Regardless, unemployment isn't a problem and doesn't show signs of becoming so.
To determine what the Fed will do, look at what they look at: r*, u* and inflation clearly illustrate that the highly restrictive interest rate policy is having its intended effect on inflation, which has fallen and will continue to fall (again, ignore the statistical noise). Higher rates are draining the system of liquidity and preventing financings from taking place. Corporate and personal defaults are on the rise, a sign that rates are biting.2 Growth is falling along with inflation, so the Fed will have to make a decision soon as to when to cut interest rates. Were it not for the higher inflation readings we received in January and February, we would likely see a near 100% probability of a cut in June. These bad readings should be corrected in the coming months. Nonetheless, we believe that Powell and the Fed, who acted too late to raise rates, will now act too late to lower them, accepting the risk of defaults in the banking and commercial real estate sectors rather than of being called "dovish" on inflation. Fortunately, with estimated real GDP growth of 3%, the Fed has room for maneuver.
With a nod to Tim Sablik at the Richmond Fed.
Many of these defaults are likely overdue. We have lived through an extraordinary time when the destructive part of Capitalism's creative destruction was inhibited for systemic reasons; perhaps the permitted existence of zombie companies which earned less than their cost of capital were in part responsible for the low growth and low r* we observe in the years post-GFC.


